Data manifest
Every SVG nf-metro renders is a self-describing, addressable artifact. A downstream tool can position overlays on it, restyle its nodes, and look up which processes a node represents, all from the committed file alone and without re-running whatever drew it.
That contract is not specific to metro maps. The format is a standalone standard, and nf-metro ships tooling to produce and consume it. Any diagram tool can emit a conforming SVG, and nf-metro is only the first producer.
Terminology
Section titled “Terminology”Because the format is tool-neutral, its vocabulary is generic rather than metro-flavoured:
| Term | Meaning |
|---|---|
| manifest | The JSON description of the diagram, embedded in the SVG. |
| node | An addressable point on the diagram, the thing a consumer locates, restyles, or lights up. Has an id, a center (x/y), a radius (r), and an optional label. |
| group | An optional multi-membership category a node can belong to several of, each with a display color (for example, a color-coded series). |
| region | An optional single-membership container a node sits inside (for example, a labeled box). |
| pattern | A regex on a node that identifies it against a runtime string. A node carries zero or more. |
| target | What the patterns are matched against, named in the manifest’s match block (for a Nextflow run, the fully-qualified process name). |
A producer with no grouping concept uses nodes alone and leaves groups and regions empty.
Metro terms and their manifest equivalents
Section titled “Metro terms and their manifest equivalents”nf-metro draws metro maps.
Its own code, .mmd files, and live server therefore speak metro: stations, lines, sections, and processes.
The renderer’s adapter translates those into the neutral wire vocabulary, and the SVG you get uses the generic terms defined earlier:
| nf-metro (metro) | Manifest (neutral) |
|---|---|
| station | node |
| line | group |
| section | region |
%%metro process: patterns | node patterns |
If you author a metro map and then read the rendered SVG, you find nodes rather than stations.
That translation is what makes the file portable.
Data carried in the SVG
Section titled “Data carried in the SVG”The data is carried two redundant ways, both sanitization-safe.
Neither uses <script>, and both survive the inline-SVG sanitizers a host web app typically runs:
- A JSON manifest in a
<metadata id="diagram-manifest">element. data-node-*attributes on each node’s wrapping<g>.
A node’s id is the join key.
It equals data-node-id="<id>" on the element.
A consumer can therefore go from manifest to element and back without guessing.
Manifest schema
Section titled “Manifest schema”{ "version": "1.0", "match": { "target": "fqProcessName", "type": "regex", "flags": "i" }, "title": "nf-core/rnaseq", "width": 1829, "height": 724, "groups": [ { "id": "star_salmon", "label": "STAR + Salmon", "color": "#e64949" } ], "regions": [{ "id": "preprocessing", "label": "Pre-processing" }], "nodes": [ { "id": "fastqc", "label": "FastQC", "x": 120.0, "y": 80.0, "r": 5.0, "groups": ["star_salmon", "star_rsem"], "region": "preprocessing", "patterns": ["FASTQC", "MULTIQC"] } ]}nodesare the addressable points, covering every node in the diagram. Unmapped nodes carry an emptypatternslist. The manifest is therefore a complete inventory rather than only the subset that lights up.idis the join key and equalsdata-node-id="<id>"on the element.- Coordinate space.
x/y/rare absolute SVG user units insideviewBox="0 0 width height", and the producer must emit no outer transform. An overlay sharing that viewBox then lines up exactly.ris a single nominal marker radius. Coordinates are rounded to one decimal place. groupsandregionsare optional metadata. A node references them by id throughnode.groupsandnode.region.- Forward compatibility. Consumers MUST ignore unknown fields, and additive fields keep the same major
version.
A machine-readable JSON Schema (draft 2020-12) ships with the package as nf_metro/manifest/schema.json, and manifest_schema() returns it as a dict.
Its required fields are exactly the minimum-conforming set.
To validate an SVG, read its manifest out and check it against the schema.
jsonschema is not an nf-metro runtime dependency, and pip install "nf-metro[validate]" adds it:
import jsonschemafrom nf_metro.manifest import read_manifest, manifest_schema
manifest = read_manifest(open("pipeline.svg").read())if manifest is None:    raise SystemExit("no diagram manifest embedded in this SVG")jsonschema.validate(manifest, manifest_schema())   # raises ValidationError if it doesn't conform
Or from the command line, without writing any code:
nf-metro validate-svg pipeline.svg# Valid: 42 nodes, schema version 1.0 (exits non-zero if it doesn't conform)validate-svg needs the same package, and pip install "nf-metro[validate]" covers it too.
Add --geometry to check the drawn picture as well as the schema.
It flags a route drawn through a station’s label or marker, with rail interchanges excepted.
The offset-collapse check, which catches distinct lines merging into one stroke, needs the engine’s assigned offsets.
It therefore runs only via render --validate.
nf-metro validate-svg pipeline.svg --geometryIn another language, extract the <metadata id="diagram-manifest"> JSON the same way and feed it, with the shipped schema.json, to any standard JSON Schema validator.
Per-node attributes
Section titled “Per-node attributes”<g data-node-id="fastqc" data-node-cx="120.0" data-node-cy="80.0" data-node-r="5.0" data-node-groups="star_salmon,star_rsem" data-node-region="preprocessing"> ...the node's drawn glyph...</g>The geometry attributes mirror the manifest’s x/y/r.
A consumer can position against either half interchangeably.
data-node-region is omitted when the node belongs to no region.
A producer may add its own attributes or classes alongside these, and nf-metro tags the group nf-metro-station-group, but only the data-node-* set is part of the contract.
Matching semantics
Section titled “Matching semantics”patterns are regular expressions matched case-insensitively against a runtime target string.
The match block names the target so that a consumer using neither Python nor Nextflow can reproduce the rule.
For a Nextflow run the target is the fully-qualified process name, such as NFCORE_RNASEQ:RNASEQ:FASTQC.
Another producer sets target to whatever identifier its own runtime emits.
Keep patterns within the regex subset common to Python re and JavaScript RegExp, so that two implementations cannot diverge.
That subset covers character classes, anchors, ./*/+/?, bounded {m,n}, alternation, and groups.
Avoid Python-only constructs such as named groups (?P<>), inline flags (?i), possessive quantifiers, and \Z.
A target may legitimately match more than one node. How to resolve that is a consumer-side policy decision rather than a schema error.
The minimum conforming file
Section titled “The minimum conforming file”The shortest path to a file a consumer can drive:
Required. An overlay positions itself from these alone:
- An SVG root with
viewBox="0 0 width height"and no outer transform. - Exactly one
<metadata id="diagram-manifest">holding the JSON, with at leastversion,width,height, andnodes, each node carrying anidandx/y/r.
Required only for matching, such as lighting up nodes from a running job:
- The
matchblock (target/type/flags) and apatternslist on each node that represents something.
Recommended. A consumer can then find and restyle the drawn node in place rather than only overlay on top of it:
- Wrap each node’s glyph in a
<g>withdata-node-id="<id>"(matching the manifestid) anddata-node-cx/-cy/-r.
Everything else is optional: label, groups, regions, and the live state model described later.
The toolkit functions
Section titled “The toolkit functions”The whole toolkit is a handful of small functions, all importable from nf_metro.manifest and re-exported from nf_metro.render.
| Function | What it does |
|---|---|
build_manifest_data(*, title, width, height, nodes, groups=(), regions=(), match_target="fqProcessName") | Assemble the manifest dict from plain node data. Rounds coordinates and fills the match block. |
node_data_attrs(*, id, x, y, r, groups=(), region=None) | Return the data-node-* attributes for one node’s element, as a dict to spread onto your <g>. |
manifest_metadata_svg(manifest) | Return only the <metadata> element as a string. Use it when you assemble the SVG yourself. |
inject_manifest(svg, manifest) | Insert that <metadata> into an existing SVG string, right after the opening <svg> tag. Returns the new SVG. |
read_manifest(svg) | Parse the embedded manifest back out of an SVG string. Returns the dict, or None if the SVG has no manifest. |
match_node_ids(manifest, target) | Node ids whose patterns match target, case-insensitively. Answers which node a runtime name lights up. |
matching_node_ids(target, patterns_by_id) | The same matcher over a plain {id: [pattern]} map, when your data is not a full manifest. |
overlay_svg(manifest, body="", *, extra_attrs="") | A transparent overlay <svg> sized to the manifest’s viewBox, to stack over the base so coordinates line up. |
manifest_json(manifest) | Deterministic JSON serialization of a manifest, with sorted keys. Rarely needed directly. |
manifest_schema() | Return the JSON Schema (draft 2020-12) for a manifest, to validate a producer’s output in any language. |
Producing a file uses the first four.
Consuming one uses read_manifest and match_node_ids, and a live overlay adds overlay_svg.
The two constants MANIFEST_SCHEMA_VERSION and MANIFEST_ELEMENT_ID ("diagram-manifest") are exported too.
Produce a conforming SVG
Section titled “Produce a conforming SVG”In Python (any diagram, not only metro maps)
Section titled “In Python (any diagram, not only metro maps)”nf_metro.manifest builds a manifest from plain node data and embeds it into an SVG you drew by any means.
It never needs a MetroGraph:
from nf_metro.manifest import (    build_manifest_data, node_data_attrs, inject_manifest,)
manifest = build_manifest_data(    title="My Tool",    width=100, height=100,    nodes=[        {"id": "trim", "x": 50, "y": 50, "r": 4, "patterns": ["TRIM.*"]},    ],)
# Decorate the node's element with the addressable mirror...attrs = node_data_attrs(id="trim", x=50, y=50, r=4)attr_str = " ".join(f'{k}="{v}"' for k, v in attrs.items())svg = f'<svg viewBox="0 0 100 100"><g {attr_str}><circle cx="50" cy="50" r="4"/></g></svg>'
# ...and splice the manifest in after the opening <svg> tag.svg = inject_manifest(svg, manifest)
Each nodes entry requires id, x, y, and r, and optionally takes label (which defaults to id), groups, region, and patterns.
Coordinates are rounded for you.
groups and regions are optional grouping metadata.
A node is addressed as a center point plus a nominal radius, which is overlay-shaped rather than the full glyph outline.
If your nodes are boxes, pass the box center as x/y and a representative radius for r.
An overlay only needs somewhere to anchor, not your exact geometry.
If your runtime does not emit Nextflow process names, set match_target to the identifier it does emit.
The file then honestly describes what its patterns match:
build_manifest_data(..., match_target="stepName")# -> "match": { "target": "stepName", "type": "regex", "flags": "i" }In any language
Section titled “In any language”You do not need this library to produce a conforming file. Emit the bytes directly:
- Draw your SVG with
viewBox="0 0 width height"and no outer transform. - Insert a
<metadata id="diagram-manifest">element holding the JSON shown earlier as CDATA. CDATA cannot contain]]>. If a regex does, split it as]]]]><![CDATA[>. - (Recommended) For each node, wrap its glyph in a
<g>carrying a stabledata-node-idand its center and radius asdata-node-cx/-cy/-r, to one decimal place. Keep this geometry in agreement with the manifest, becauseidis the join key between them.
Read and match
Section titled “Read and match”nf_metro.render re-exports the canonical reader and matcher, which are also available from nf_metro.manifest:
from nf_metro.render import read_manifest, match_node_ids
manifest = read_manifest(open("pipeline.svg").read())match_node_ids(manifest, "NFCORE_RNASEQ:RNASEQ:FASTQC")   # -> ["fastqc"]
read_manifest is a plain regex extract and needs no XML library.
A consumer in another language reproduces the matcher by walking nodes[].patterns, testing each regex case-insensitively against the target, and collecting the ids that match.
match_node_ids takes a whole manifest, keyed on the schema’s nodes.
matching_node_ids is the same matcher over a plain id -> [pattern] mapping, for a producer whose data is not manifest-shaped.
Drive a live overlay: the state snapshot
Section titled “Drive a live overlay: the state snapshot”Everything earlier defines the static compatibility contract of geometry and addressing. The second, optional half is the runtime state vocabulary that drives a progress overlay. A consumer that only needs static addressing can stop at the manifest.
The manifest gives an overlay everything it needs without a re-render: the viewBox to share, and each node’s id, center, and radius.
The standard fixes the geometry, the addressing, and the state vocabulary defined here, but not the visual style.
How you draw running against done, whether as a halo, a badge, or a color change on the node itself, is up to you.
The three layers
Section titled “The three layers”Three layers, each narrower than the last:
- The standard. This manifest schema plus the state snapshot schema in this section. It is tool-neutral, and any producer can emit it.
- A binding. It turns one runtime’s native events into the state snapshot.
nf-metro ships one binding for Nextflow: the
-with-weblogHTTP receiver (nf-metro serve) and, optionally, the nf-metro Nextflow plugin that configures it from pipeline config. A binding for another workflow engine or CI system would translate that system’s own events into the same snapshot shape instead. - nf-metro itself. One producer of conforming SVGs, and the author of that binding. A consumer that already owns authoritative task state, such as a platform that tracks a run’s tasks directly, needs only layer 1: the manifest and this state vocabulary. It needs neither the weblog server nor the plugin.
The snapshot shape
Section titled “The snapshot shape”A snapshot is the full progress picture at one instant: every node’s display state, plus the run’s own lifecycle state.
The nf-metro live server serves one at GET /state, and pushes a fresh one as the data: payload of every Server-Sent Event on GET /stream:
{ "run": { "name": "grave_babbage", "state": "running" }, "stations": { "trim": { "state": "done", "done": 2, "total": 2 }, "qc": { "state": "running", "done": 0, "total": 1 } }}stationsis keyed by node id, the sameida manifest node anddata-node-idcarry, and a consumer joins the two without any translation. A node the runtime has not reported on yet is absent from a hand-built snapshot. In the nf-metro server it is present as{state: "pending", done: 0, total: 0}, because the server pre-populates every mapped node and a fresh subscriber never sees a missing key.runis one lifecycle value for the whole snapshot, not one per node.
A machine-readable JSON Schema (draft 2020-12) ships with the package as nf_metro/live/state_schema.json, and state_schema() returns it as a dict, mirroring manifest_schema():
import jsonschemafrom nf_metro.live import state_schema
jsonschema.validate(snapshot, state_schema())   # raises ValidationError if it doesn't conform
Unlike the manifest, no version field travels inside the snapshot itself, because it is a live response rather than a durable artifact committed to a repo.
The schema file carries its own version on disk as STATE_SCHEMA_VERSION ("1.0"), and evolves under the same forward-compatibility rule as the manifest.
The state enum and its transitions
Section titled “The state enum and its transitions”Each station’s state is one of:
| State | Meaning |
|---|---|
pending | No task has been submitted for this node yet. The initial value. |
queued | At least one task has been submitted, and none of them is running yet. done may already be greater than 0 if an earlier task for the same node finished before this one was submitted. |
running | At least one task for this node is currently running. |
done | Every task submitted for this node reached a terminal status, and none of them failed. |
failed | Sticky. Once any task for this node has failed, it reports failed for the rest of the run, even if other tasks for the same node are later running or complete. |
When several conditions hold at once, a producer must apply the precedence failed > running > queued > done > pending, checked in that order.
A node with one failed task and another still running therefore reads failed, never running.
done / total semantics
Section titled “done / total semantics”totalis the count of tasks submitted so far for this node in the current run, not a fixed denominator. A workflow engine’s task count for a node is dynamic, for instance when scattering over samples.totaltherefore reflects only what has been seen so far, and it can still grow after the node starts reportingrunning.doneis the count of tasks that have reached a successful terminal status for this node so far. A failed task is not counted indone.- Both are cumulative across the run and reset only by a fresh
startedevent, described later. They never decrease mid-run.
Run lifecycle
Section titled “Run lifecycle”The run object’s state is one lifecycle shared by the whole snapshot:
| State | Meaning |
|---|---|
idle | No run has reported in yet. The initial value, with name set to null. |
running | A run has announced itself as started, and no terminal event has followed yet. |
complete | The run finished successfully. |
error | The run (or the binding reporting it) signaled a failure. |
Only a fresh started-equivalent event moves a run off complete or error, and doing so resets every station back to pending/0/0.
Re-running the same pipeline therefore re-animates a clean map rather than layering a new run’s progress on top of the last one’s leftovers.
Forward compatibility
Section titled “Forward compatibility”The rule is the same as for the manifest: consumers MUST ignore unknown fields.
A producer can therefore add fields to run, to a station entry, or a wholly new top-level key without breaking an existing reader.
A change that is not purely additive, such as removing a field, changing an enum’s existing members, or changing done/total semantics, is a breaking change.
It bumps the schema file’s own version and the nf-metro major version together, exactly as for the manifest.
Bring your own binding
Section titled “Bring your own binding”The nf-metro serve command is one reference implementation.
It turns the Nextflow -with-weblog task events into the snapshot shown earlier, mapping process_submitted to queued, process_started to running, and process_completed to done or failed depending on status.
It then draws a glowing halo per node and recolors it by state (see Live progress).
A host application can write its own binding from its own runtime’s events to this same snapshot shape.
It can map the state vocabulary onto its own visual language, whether that is filled badges, a progress bar, or a color change on the node itself.
Tutorial: light up a diagram as a job runs
Section titled “Tutorial: light up a diagram as a job runs”A complete, self-contained example for a tool that is not nf-metro.
By the end you will have a small pipeline diagram that shows progress as work happens.
Every snippet runs as written, with no pipeline, no server, and no Nextflow, because the progress is faked.
It comes to about 80 lines and uses only nf_metro.manifest.
The idea. Draw the diagram once and embed a manifest in it. Then, whenever progress changes, draw a thin overlay of status markers on top. The diagram itself never re-flows, and only the lightweight overlay updates. The example models a three-step pipeline: Fetch, Align, and Report.
What’s doing the work. The only library is nf_metro.manifest, the standard-library-only module described earlier.
There is no MetroGraph, no nf-metro renderer, and no drawing or templating library.
We assemble the SVG as plain Python strings and use nf_metro.manifest for four manifest-specific jobs: building it (build_manifest_data), embedding it (node_data_attrs, inject_manifest), reading it back (read_manifest), and matching runtime names to nodes (match_node_ids).
Step 1 - draw the diagram and embed a manifest
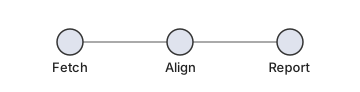
Section titled “Step 1 - draw the diagram and embed a manifest”We hand-draw three circles, one per step, wrap each in a <g> carrying its data-node-* attributes, and splice in the manifest.
- For now, the fields that matter are
idandx/y/r: the node’s name, where it sits, and how big it is. An overlay anchors to these. - Later,
patterns(the names this node answers to) andmatch_targetmatter for Step 2’s matching. Ignore them until then. Because this example matches against step names, it setsmatch_target="stepName".
from nf_metro.manifest import (    build_manifest_data, node_data_attrs, inject_manifest,    read_manifest, match_node_ids,)
NODES = [    {"id": "fetch",  "label": "Fetch",  "x": 70,  "y": 42, "r": 13, "patterns": ["FETCH"]},    {"id": "align",  "label": "Align",  "x": 180, "y": 42, "r": 13, "patterns": ["BWA.*", "STAR.*"]},    {"id": "report", "label": "Report", "x": 290, "y": 42, "r": 13, "patterns": ["MULTIQC"]},]W, H = 360, 92
def node_svg(n):    attrs = " ".join(        f'{k}="{v}"'        for k, v in node_data_attrs(id=n["id"], x=n["x"], y=n["y"], r=n["r"]).items()    )    return (        f'<g {attrs}>'        f'<circle cx="{n["x"]}" cy="{n["y"]}" r="{n["r"]}" fill="#dfe3ee" stroke="#333"/>'        f'<text x="{n["x"]}" y="{n["y"] + 30}" text-anchor="middle" font-size="13">{n["label"]}</text>'        f'</g>'    )
edges = (    '<line x1="83" y1="42" x2="167" y2="42" stroke="#aaa"/>'    '<line x1="193" y1="42" x2="277" y2="42" stroke="#aaa"/>')base = (    f'<svg xmlns="http://www.w3.org/2000/svg" viewBox="0 0 {W} {H}" width="{W}" height="{H}">'    f'{edges}{"".join(node_svg(n) for n in NODES)}</svg>')svg = inject_manifest(    base,    build_manifest_data(        title="Toy pipeline", width=W, height=H, nodes=NODES, match_target="stepName"    ),)
Three functions did the work.
node_data_attrs produced each node’s data-node-* attributes, build_manifest_data assembled the manifest from the node list, and inject_manifest placed that manifest inside the SVG.
svg is now a self-describing file: three labeled nodes, a <metadata id="diagram-manifest"> block, and data-node-* attributes.
Save it to a .svg if you like, because everything later works from that file alone.
Step 2 - connect the diagram to the work
Section titled “Step 2 - connect the diagram to the work”Something has to run your pipeline’s steps, whether that is a workflow engine, a CI job, or a plain script.
Call it the runtime.
As it works, it announces each step by a name: it might log that a step called BWA_MEM has started, then that it finished.
Those names cause two problems.
You usually do not choose them, because a tool may call your “Align” step BWA_MEM or STAR_ALIGN.
They also rarely equal your node ids.
Each node’s patterns exist for exactly this: regexes that match the names your runtime uses.
match_node_ids answers which node a name belongs to:
manifest = read_manifest(svg)
match_node_ids(manifest, "BWA_MEM")   # -> ['align']match_node_ids(manifest, "multiqc")   # -> ['report']  (matching is case-insensitive)
Nothing is running yet, and this only queries the file. Matching is the bridge from “a name the runtime mentioned” to “a node on the diagram”.
Step 3 - show progress
Section titled “Step 3 - show progress”Give each node a state, one of pending, queued, running, done, or failed, and draw a colored ring per node at its manifest position.
The colors are your choice, because the standard only tells you where each node is:
COLORS = {    "pending": "#b8c0d0", "queued": "#ffb020",    "running": "#ffc23a", "done": "#2bee92", "failed": "#ff4d4d",}
def progress_halos(manifest, states):    """One status ring per node, positioned from the manifest geometry."""    return "".join(        f'<circle cx="{n["x"]}" cy="{n["y"]}" r="{n["r"] + 5}" fill="none" '        f'stroke="{COLORS[states.get(n["id"], "pending")]}" stroke-width="3.5"/>'        for n in manifest["nodes"]    )
A tutorial has no real runtime.
Simulate one instead.
The list that follows holds (step_name, new_state) announcements of the kind a real engine sends as a run progresses.
Fold each one into a {node_id: state} map using Step 2’s matcher, then redraw the overlay.
That sequence of redraws is the animation:
# A real runtime would send these live; we hard-code them so the tutorial runs# on its own.events = [    ("FETCH",   "running"), ("FETCH",   "done"),    ("BWA_MEM", "running"), ("BWA_MEM", "done"),   # the Align step, by its tool name    ("MULTIQC", "running"), ("MULTIQC", "done"),   # the Report step]
states = {}for name, new_state in events:    for node_id in match_node_ids(manifest, name):        states[node_id] = new_state    frame = svg.replace("</svg>", progress_halos(manifest, states) + "</svg>")    # draw `frame`: write it to a file, or update the page in a browser
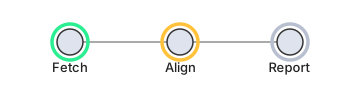
A single frame taken just after Fetch finished and Align started, when states is {"fetch": "done", "align": "running"}, looks like this.
Green is done, amber is running, and gray is still pending:
Replaying the whole events list redraws the overlay step by step and animates the run from start to finish:
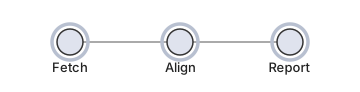
The rings are deliberately plain. Swap in pulses, fills, per-node counts, or your own palette without touching the contract.
Step 4 - plug in a real runtime
Section titled “Step 4 - plug in a real runtime”Up to now everything ran in one Python script.
In a real system the same logic splits between an event source, whatever runs your pipeline, and a UI, usually a browser.
Only one thing in this tutorial was fake: the hard-coded events list.
Replace it with announcements from a real run and nothing else changes.
You still match_node_ids each name to a node (Step 2) and fold it into the states map that progress_halos draws (Step 3).
What Nextflow does, in the tutorial’s terms. Run a pipeline with nextflow run ... -with-weblog http://localhost:8080/events and Nextflow becomes the source of that events list.
Every time a task is submitted, starts, or finishes, it POSTs a small JSON message to that URL carrying the process name and its status.
It sends you ("BWA_MEM", "running"), then ("BWA_MEM", "done"), live, instead of you writing them out.
What nf-metro serve is. This same tutorial running as a small web server.
You write none of the Python yourself:
- It renders the diagram’s SVG once and builds an overlay of one ring per node, positioned from each node’s coordinates, on the same principle as
progress_halos. - It listens on
http://localhost:8080/, where/eventsis the URL Nextflow POSTs to. - On each message it runs Step 2 (
match_node_idson the process name) and Step 3 (fold the result into a per-nodestatesmap). - It pushes the updated
statesto the open browser page over Server-Sent Events, and the page recolors the matching overlay ring.
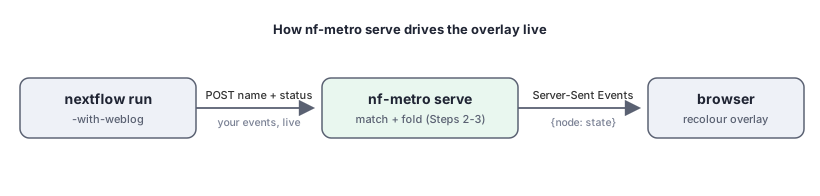
nf-metro serve is therefore this tutorial connected to a live event source and a browser.
See Live progress to run it.
That page also covers the multi-run dashboard and the optional Nextflow plugin.
The glowing-LED styling there is its own choice, and yours can differ.
Doing it yourself in a browser takes the same three steps client-side: read_manifest on the committed SVG, match_node_ids per incoming event, then restyle the matched node.
Keep the overlay as a separate layer over the base so you never redraw the diagram.
overlay_svg builds one sized to match, and coordinates line up:
from nf_metro.manifest import overlay_svg
# a transparent layer the same size/viewBox as the base, holding the rings:layer = overlay_svg(manifest, progress_halos(manifest, states),                    extra_attrs='style="pointer-events:none"')# stack `layer` directly over the base SVG; on each event, update its rings.
The complete script
Section titled “The complete script”Everything earlier as one file.
It needs only nf-metro installed (pip install nf-metro), and it writes the diagram plus one frame per event, with no pipeline or server.
Save it as demo.py, run python demo.py, then open toy_pipeline.svg and the progress_*.svg frames in order.
You should get one static diagram plus six frames that turn Fetch, then Align, then Report from gray through amber to green, with the terminal printing each event as it maps to a node.
"""Make a conforming SVG and drive it from a stream of (step, state) events.
Uses only nf_metro.manifest (Python standard library only) - no pipeline, noserver. Run `python demo.py`, then open toy_pipeline.svg and progress_*.svg."""
from nf_metro.manifest import (    build_manifest_data, node_data_attrs, inject_manifest,    read_manifest, match_node_ids,)
# --- the diagram: one node per pipeline step --------------------------------NODES = [    {"id": "fetch",  "label": "Fetch",  "x": 70,  "y": 42, "r": 13, "patterns": ["FETCH"]},    {"id": "align",  "label": "Align",  "x": 180, "y": 42, "r": 13, "patterns": ["BWA.*", "STAR.*"]},    {"id": "report", "label": "Report", "x": 290, "y": 42, "r": 13, "patterns": ["MULTIQC"]},]W, H = 360, 92
def node_svg(n):    attrs = " ".join(        f'{k}="{v}"'        for k, v in node_data_attrs(id=n["id"], x=n["x"], y=n["y"], r=n["r"]).items()    )    return (        f'<g {attrs}>'        f'<circle cx="{n["x"]}" cy="{n["y"]}" r="{n["r"]}" fill="#dfe3ee" stroke="#333"/>'        f'<text x="{n["x"]}" y="{n["y"] + 30}" text-anchor="middle" font-size="13">{n["label"]}</text>'        f'</g>'    )
edges = (    '<line x1="83" y1="42" x2="167" y2="42" stroke="#aaa"/>'    '<line x1="193" y1="42" x2="277" y2="42" stroke="#aaa"/>')base = (    f'<svg xmlns="http://www.w3.org/2000/svg" viewBox="0 0 {W} {H}" width="{W}" height="{H}">'    f'{edges}{"".join(node_svg(n) for n in NODES)}</svg>')svg = inject_manifest(    base,    build_manifest_data(        title="Toy pipeline", width=W, height=H, nodes=NODES, match_target="stepName"    ),)with open("toy_pipeline.svg", "w") as f:    f.write(svg)print("wrote toy_pipeline.svg  (the conforming diagram)")
# --- drive it from a stream of events ---------------------------------------COLORS = {    "pending": "#b8c0d0", "queued": "#ffb020",    "running": "#ffc23a", "done": "#2bee92", "failed": "#ff4d4d",}
def progress_halos(manifest, states):    return "".join(        f'<circle cx="{n["x"]}" cy="{n["y"]}" r="{n["r"] + 5}" fill="none" '        f'stroke="{COLORS[states.get(n["id"], "pending")]}" stroke-width="3.5"/>'        for n in manifest["nodes"]    )
# In a real run these arrive live (e.g. from Nextflow's -with-weblog); here we# hard-code them so the demo runs on its own.events = [    ("FETCH",   "running"), ("FETCH",   "done"),    ("BWA_MEM", "running"), ("BWA_MEM", "done"),   # the Align step, by its tool name    ("MULTIQC", "running"), ("MULTIQC", "done"),   # the Report step]
manifest = read_manifest(svg)states = {}for i, (name, state) in enumerate(events):    hits = match_node_ids(manifest, name)        # which node(s) does this name light up?    for node_id in hits:        states[node_id] = state    frame = svg.replace("</svg>", progress_halos(manifest, states) + "</svg>")    with open(f"progress_{i}.svg", "w") as f:        f.write(frame)    print(f"  event {name:<8} {state:<8} -> {hits}")
print(f"wrote progress_0.svg .. progress_{len(events) - 1}.svg  (open them in order)")
Swap the hard-coded events for messages from your real runtime, or let nf-metro serve do it as in Step 4, and the same loop drives a live diagram.