Qualimap
What is Qualimap?
Section titled “What is Qualimap?”Qualimap is a platform-independent application for quality control of sequencing alignment data. RustQC reimplements the rnaseq mode of Qualimap, producing identical output that is directly parseable by MultiQC.
The Qualimap analysis runs automatically as part of rustqc rna in the same
single-pass BAM scan as all other analyses — no extra BAM pass is needed.
What it provides
Section titled “What it provides”RustQC’s Qualimap module computes:
- Gene body coverage profiles: coverage distribution along normalized transcript positions from 5’ to 3’, revealing systematic biases such as 3’ degradation or incomplete reverse transcription
- 5’/3’ bias metrics: quantitative measures of coverage uniformity across gene bodies, used for sample QC and batch-effect detection
- Read origin classification: counts reads as exonic, intronic, intergenic, or overlapping multiple genes’ exons
- Strand-specificity estimation: validates whether the observed strand distribution matches the expected library protocol
- Splice junction motif analysis: counts canonical and non-canonical donor/acceptor junction motifs across all uniquely-mapped reads
- Alignment statistics: primary/secondary alignments, multi-mappers, proper pairs, and supplementary read counts
Output files
Section titled “Output files”All Qualimap output files are written to a qualimap/ subdirectory under the
output directory, matching the directory structure that MultiQC expects.
Directoryqualimap/
- qualimapReport.html Self-contained HTML report
rnaseq_qc_results.txtQualimap-compatible QC reportDirectory
raw_data_qualimapReport/coverage_profile_along_genes_(total).txtCoverage profile (all genes)coverage_profile_along_genes_(high).txtCoverage profile (highly expressed genes)coverage_profile_along_genes_(low).txtCoverage profile (lowly expressed genes)
Directory
images_qualimapReport/Coverage Profile Along Genes (Total).pngGene body coverage chartCoverage Profile Along Genes (High).pngCoverage chart (highly expressed genes)Coverage Profile Along Genes (Low).pngCoverage chart (lowly expressed genes)Transcript coverage histogram.pngCoverage depth histogram (0-50X)Reads Genomic Origin.pngExonic/intronic/intergenic pie chartJunction Analysis.pngKnown/novel junction pie chart
QC results
Section titled “QC results”File: rnaseq_qc_results.txt
The main QC report, formatted identically to Qualimap’s rnaseq output. This file is the primary input for MultiQC’s Qualimap rnaseq module. It contains four sections:
>>>>>>> Input bam file = sampleReads alignment
Section titled “Reads alignment”Alignment-level statistics for all primary reads:
>>>>>>> Reads alignment reads aligned (left/right) = 86,909,417 / 86,888,892 read pairs aligned = 86,778,882 total alignments = 189,114,475 secondary alignments = 15,316,166 non-unique alignments = 26,451,119 aligned to genes = 122,500,822 ambiguous alignments = 2,422,409 no feature assigned = 37,740,125 not aligned = 12,490,977 SSP estimation (fwd/rev) = 0.04 / 0.96| Field | Description |
|---|---|
| reads aligned | Total primary alignments (excluding secondary, supplementary, QC-fail) |
| total alignments | All mapped reads (primary + secondary) |
| secondary alignments | Alignments flagged as secondary (0x100) |
| non-unique alignments | Multi-mappers (NH tag > 1) |
| aligned to genes | Reads assigned to exactly one gene (exonic) |
| ambiguous alignments | Reads enclosed by multiple genes |
| no feature assigned | Reads with no enclosing gene annotation |
| not aligned | Unmapped reads encountered in the BAM |
| SSP estimation | Strand-specificity proportions (forward / reverse) |
Reads genomic origin
Section titled “Reads genomic origin”Per-base classification of read origin, counting each read’s aligned bases against the annotation:
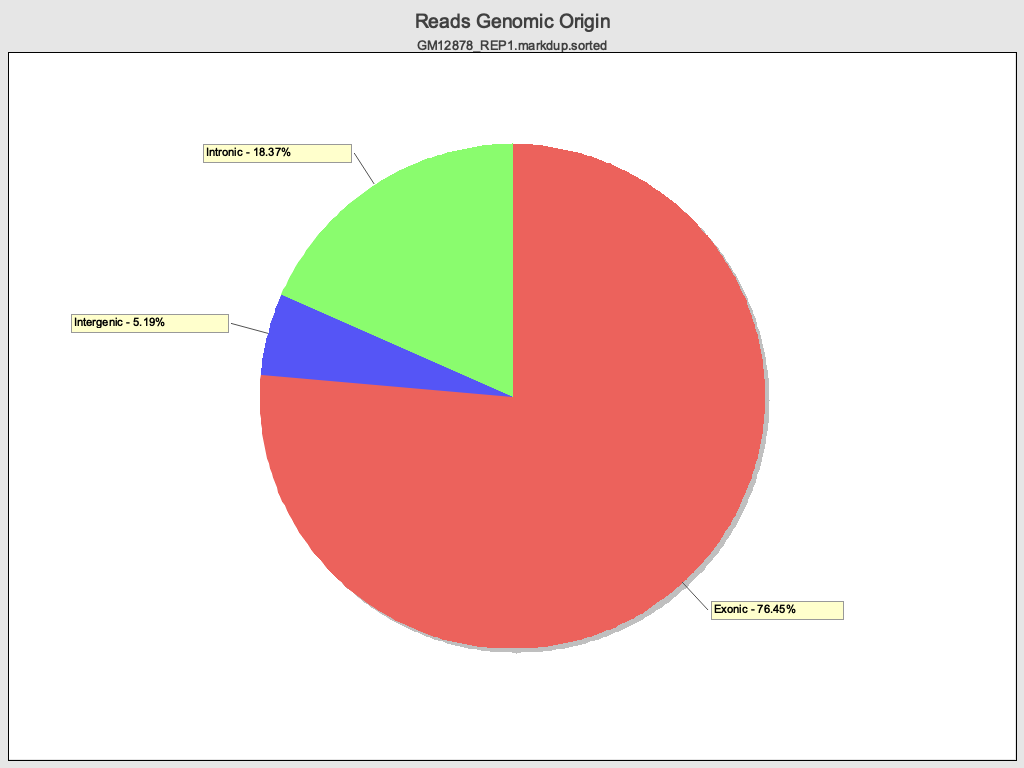
>>>>>>> Reads genomic origin exonic = 122,500,822 (76.45%) intronic = 29,504,572 (18.37%) intergenic = 8,344,022 (5.19%) overlapping exon = 6,754,726 (4.20%)| Field | Description |
|---|---|
| exonic | Reads fully enclosed by a single gene’s exons |
| intronic | Reads overlapping introns but not exons |
| intergenic | Reads in regions with no gene annotation |
| overlapping exon | Reads partially overlapping exons (not fully enclosed) |
Transcript coverage profile
Section titled “Transcript coverage profile”Coverage bias metrics computed from the gene body coverage profile:
>>>>>>> Transcript coverage profile 5' bias = 0.87 3' bias = 0.77 5'-3' bias = 1.11| Metric | Description |
|---|---|
| 5’ bias | Ratio of median coverage in the 5’ region (first 100bp) to the median of the middle 80% |
| 3’ bias | Ratio of median coverage in the 3’ region (last 100bp) to the median of the middle 80% |
| 5’-3’ bias | Ratio of 5’ median to 3’ median |
Bias values close to 1.0 indicate uniform coverage. Values significantly above 1.0 for 5’ bias or below 1.0 for 3’ bias suggest degradation or protocol issues.
Coverage profiles
Section titled “Coverage profiles”Files: coverage_profile_along_genes_(total|high|low).txt
Tab-separated files with 100 rows, one per percentile bin (0-99), showing the normalized coverage depth at each position along the gene body:
| Column | Description |
|---|---|
| Position | Percentile position along gene body (0.0 to 99.0) |
| Coverage | Normalized coverage depth at this position |
Three tiers are produced:
| Tier | File | Description |
|---|---|---|
| Total | coverage_profile_along_genes_(total).txt | All expressed genes |
| High | coverage_profile_along_genes_(high).txt | Top 500 genes by mean coverage |
| Low | coverage_profile_along_genes_(low).txt | Bottom 500 genes by mean coverage |
The total profile is the one parsed by MultiQC for the gene body coverage plot.
Qualimap chart images
Section titled “Qualimap chart images”Chart images are generated in images_qualimapReport/, matching the plots
produced by Qualimap’s HTML report:
Coverage Profile Along Genes (Total)
Section titled “Coverage Profile Along Genes (Total)”.png)
.png)
Coverage Profile Along Genes (High)
Section titled “Coverage Profile Along Genes (High)”.png)
.png)
Coverage Profile Along Genes (Low)
Section titled “Coverage Profile Along Genes (Low)”.png)
.png)
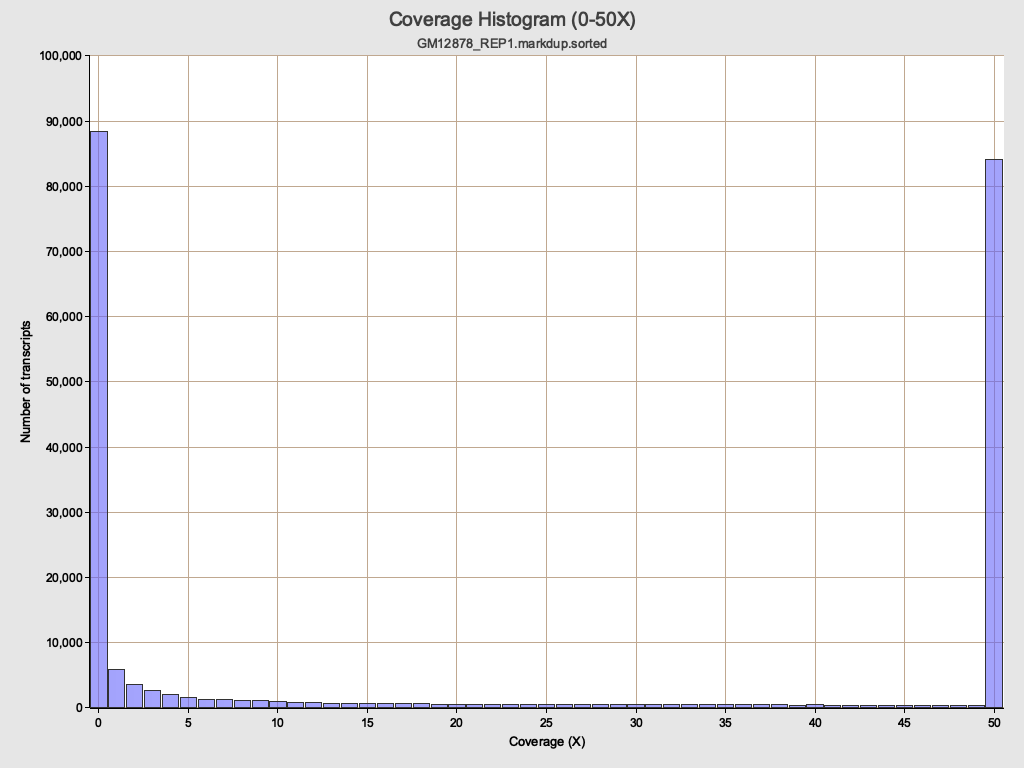
Transcript coverage histogram
Section titled “Transcript coverage histogram”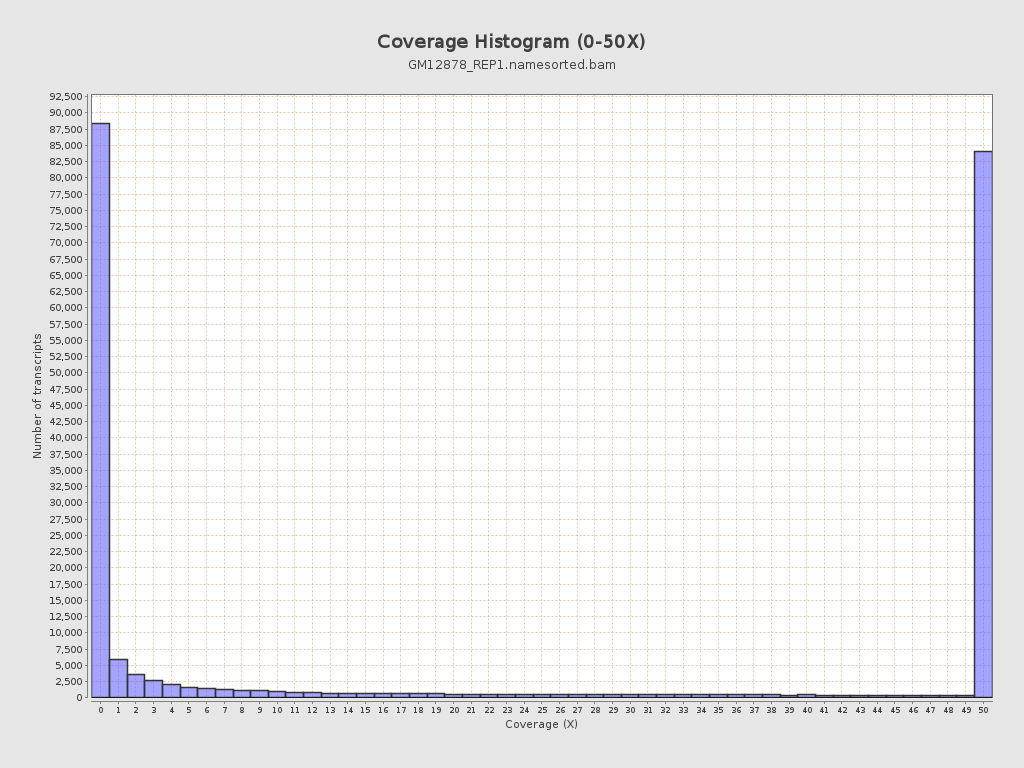
Reads Genomic Origin
Section titled “Reads Genomic Origin”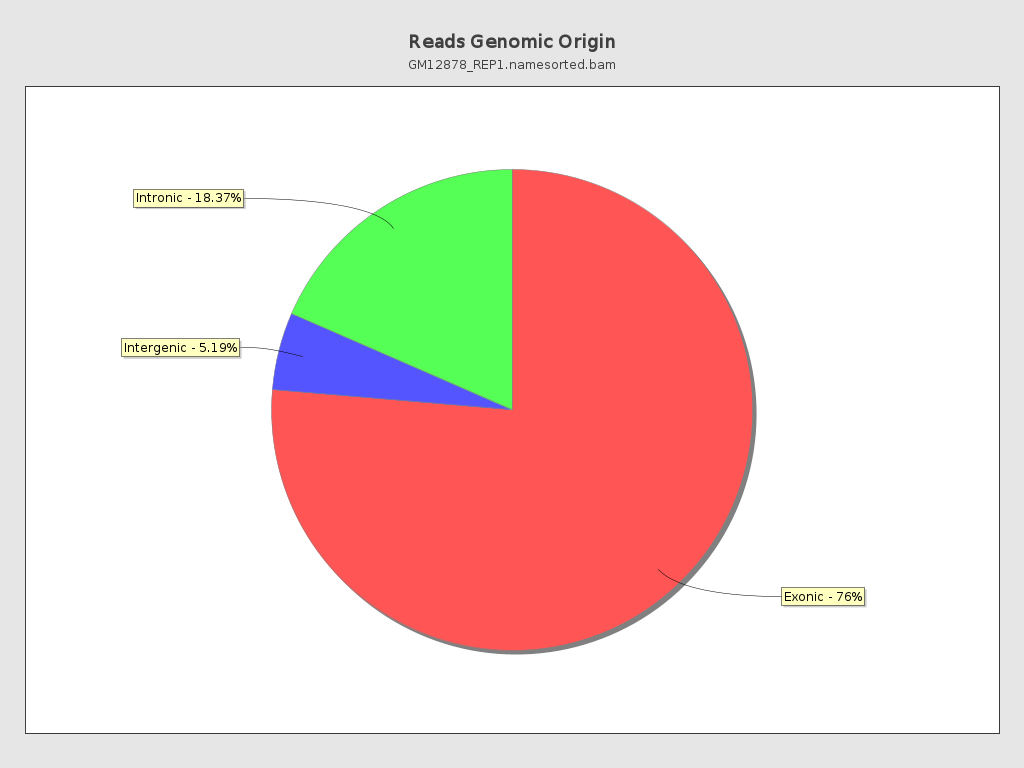
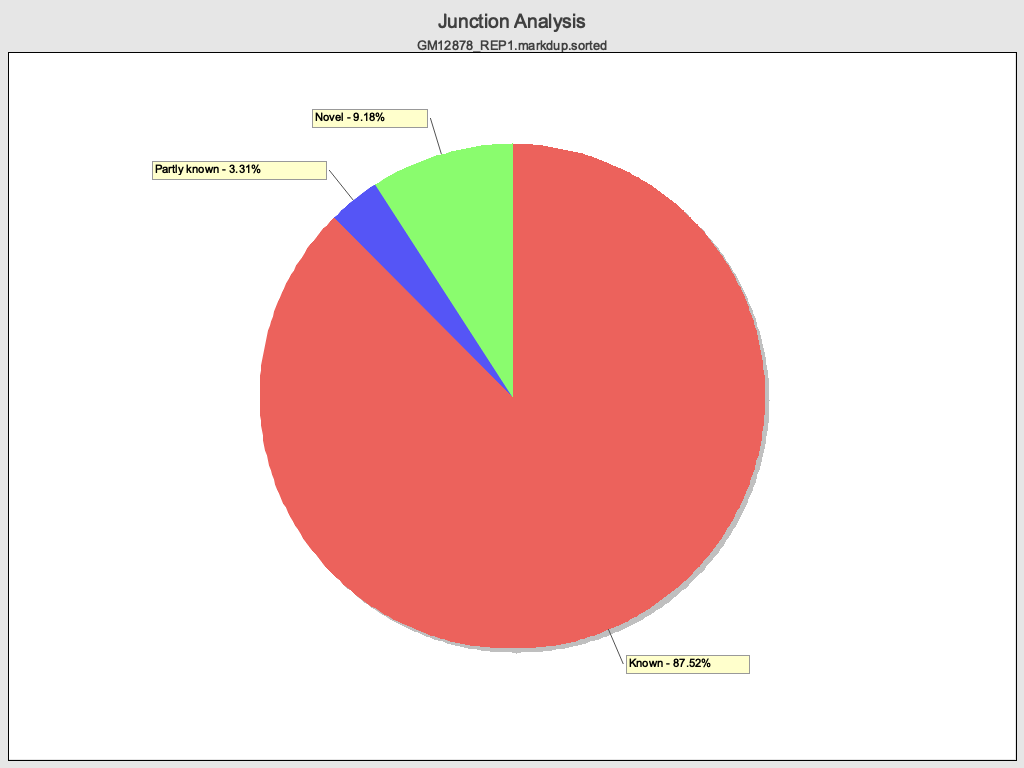
Junction Analysis
Section titled “Junction Analysis”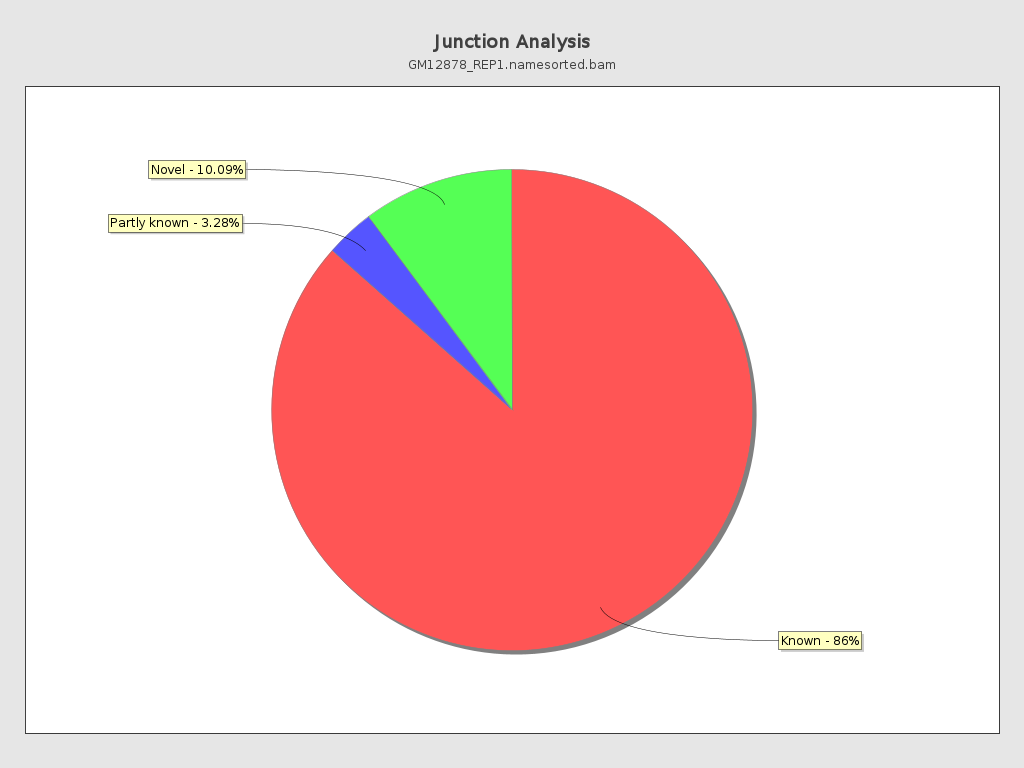
HTML report
Section titled “HTML report”File: qualimapReport.html
A self-contained HTML report matching Qualimap’s layout and styling, including all six chart images, summary tables, and a sidebar table of contents. The report uses embedded CSS and base64-encoded assets so it can be viewed in any browser without external dependencies.
View an example HTML report
Interpreting results
Section titled “Interpreting results”Gene body coverage shape
Section titled “Gene body coverage shape”| Pattern | Interpretation |
|---|---|
| Flat/uniform | Good library quality — even coverage across transcripts |
| 3’ bias (rising right) | RNA degradation or oligo-dT priming bias |
| 5’ bias (rising left) | Incomplete reverse transcription or random-priming protocol |
| Both-end dropout | Short fragment library or size-selection issue |
Bias metrics
Section titled “Bias metrics”| Metric | Good | Problematic |
|---|---|---|
| 5’-3’ bias | 0.8 - 1.2 | < 0.5 or > 2.0 |
| 5’ bias | 0.8 - 1.2 | > 2.0 (enrichment) or < 0.5 (depletion) |
| 3’ bias | 0.8 - 1.2 | > 2.0 (enrichment) or < 0.5 (depletion) |
Strand specificity
Section titled “Strand specificity”For strand-specific libraries, one of the SSP values should be close to 1.0 and the other close to 0.0. Common patterns:
| Library type | Expected fwd | Expected rev |
|---|---|---|
| Unstranded | ~0.5 | ~0.5 |
| dUTP / Illumina TruSeq Stranded | ~0.02-0.05 | ~0.95-0.98 |
| Ligation (e.g. SMARTer) | ~0.95-0.98 | ~0.02-0.05 |
Benchmarks
Section titled “Benchmarks”RustQC’s Qualimap analysis runs in the same single-pass BAM scan as all other tools, eliminating the separate name-sort and Qualimap run required by the original Java implementation.
Performance
Section titled “Performance”Large dataset (~186M reads, GM12878)
| Tool | Runtime | Peak RSS | Notes |
|---|---|---|---|
samtools sort -n | 12m 16s | 5.2 GB | Name-sort required by Qualimap Java (not needed by RustQC) |
| Qualimap rnaseq (Java) | 49m 58s | 4.9 GB | Separate BAM pass, single-threaded, requires name-sorted input |
| Total upstream pipeline | ~1h 2m 14s | Name-sort + Qualimap combined | |
| RustQC (all tools) | 14m 54s | 11.4 GB | Single pass, all analyses combined, coordinate-sorted input |
Small dataset (~52K reads, chr6)
| Tool | Runtime | Peak RSS | Notes |
|---|---|---|---|
| Qualimap rnaseq (Java) | 5.0s | 704.6 MB | Separate BAM pass, requires name-sorted input |
| RustQC (all tools) | 25.9s | 182.1 MB | Single pass, all analyses combined |
Note: RustQC runtime shown is for all tools combined in a single pass. See Benchmark Details for a full breakdown.
On the small dataset, RustQC uses 182 MB of memory vs Qualimap’s 705 MB.
Output comparison
Section titled “Output comparison”RustQC produces output effectively identical to Qualimap Java.
Both tools were run on the same BAM file with matching parameters
(--stranded reverse / strand-specific-reverse, same GENCODE GTF). Results below
are from the AWS benchmark run (2026-03-09).
Small dataset (~52K reads, chr6)
Reads alignment
Section titled “Reads alignment”| Metric | Qualimap (Java) | RustQC | Match? |
|---|---|---|---|
| reads aligned (left) | 24,797 | 24,797 | Yes |
| reads aligned (right) | 24,776 | 24,776 | Yes |
| read pairs aligned | 24,773 | 24,773 | Yes |
| total alignments | 52,839 | 52,839 | Yes |
| secondary alignments | 3,266 | 3,266 | Yes |
| non-unique alignments | 5,496 | 5,496 | Yes |
| aligned to genes | 31,654 | 31,654 | Yes |
| ambiguous alignments | 1,054 | 1,054 | Yes |
| no feature assigned | 14,635 | 14,635 | Yes |
| not aligned | 0 | 0 | Yes |
Reads genomic origin
Section titled “Reads genomic origin”| Metric | Qualimap (Java) | RustQC | Match? |
|---|---|---|---|
| exonic fraction | 68.38% | 68.38% | Yes |
| intronic fraction | 29.57% | 29.57% | Yes |
| intergenic fraction | 2.04% | 2.04% | Yes |
Transcript coverage profile
Section titled “Transcript coverage profile”| Metric | Qualimap (Java) | RustQC | Match? |
|---|---|---|---|
| 5’ bias | 0.71 | 0.71 | Yes |
| 3’ bias | 0.57 | 0.57 | Yes |
| 5’-3’ bias | 1.30 | 1.19 | Minor diff |
The 5’-3’ bias shows a minor difference (1.30 vs 1.19) on this small dataset. All other values are identical.
Large dataset (~186M reads, GM12878)
Reads alignment
Section titled “Reads alignment”| Metric | Qualimap (Java) | RustQC | Match? |
|---|---|---|---|
| reads aligned (left) | 86,909,417 | 86,909,417 | Yes |
| reads aligned (right) | 86,888,892 | 86,888,892 | Yes |
| read pairs aligned | 86,778,882 | 86,778,882 | Yes |
| total alignments | 189,114,475 | 189,114,475 | Yes |
| secondary alignments | 15,316,166 | 15,316,166 | Yes |
| non-unique alignments | 26,451,119 | 26,451,119 | Yes |
| aligned to genes | 122,500,822 | 122,500,822 | Yes |
| ambiguous alignments | 2,422,409 | 2,422,409 | Yes |
| no feature assigned | 37,740,125 | 37,740,125 | Yes |
| not aligned | 12,490,977 | 12,490,977 | Yes |
Reads genomic origin
Section titled “Reads genomic origin”| Metric | Qualimap (Java) | RustQC | Match? |
|---|---|---|---|
| exonic fraction | 76.45% | 76.45% | Yes |
| intronic fraction | 18.37% | 18.37% | Yes |
| intergenic fraction | 5.19% | 5.19% | Yes |
| overlapping exon | 4.20% | 4.20% | Yes |
Transcript coverage profile
Section titled “Transcript coverage profile”| Metric | Qualimap (Java) | RustQC | Match? |
|---|---|---|---|
| 5’ bias | 0.87 | 0.87 | Yes |
| 3’ bias | 0.77 | 0.77 | Yes |
| 5’-3’ bias | 1.11 | 1.11 | Yes |
Junction analysis
Section titled “Junction analysis”| Metric | Qualimap (Java) | RustQC | Match? |
|---|---|---|---|
| reads at junctions | 56,119,719 | 56,119,719 | Yes |
Junction motif type percentages match with rounding differences less than 0.05 percentage points. The underlying read counts are identical.
HTML reports
Section titled “HTML reports”Both tools produce an HTML report with embedded charts and summary tables. View the full reports from the large benchmark run:
Note that RustQC base64-encodes all assets within the HTML file, so it can be shared stand-alone.
Configuration
Section titled “Configuration”Gene body coverage can be enabled or disabled in the config. See the Configuration page for details.
References
Section titled “References”- Qualimap: Garcia-Alcalde F, Okonechnikov K, Carbonell J, et al. Qualimap: evaluating next-generation sequencing alignment data. Bioinformatics. 2012;28(20):2678-2679. Qualimap website