Preseq
What is preseq?
Section titled “What is preseq?”Preseq estimates library complexity by extrapolating the expected number of distinct molecules at increasing sequencing depths. This helps answer a practical question: if I sequence more, will I discover new molecules?
RustQC reimplements the preseq lc_extrap command, matching the behavior of
Preseq v3.2.0 (the version used by nf-core/rnaseq).
On Linux, the output is byte-identical to upstream Preseq. On macOS, minor
differences may occur due to different std::binomial_distribution implementations
between libstdc++ (Linux) and libc++ (macOS) - see Compatibility
below. The analysis runs automatically as part of rustqc rna at zero additional
BAM reading cost — fragment counting happens in the same single-pass BAM scan as
all other analyses.
Why it matters
Section titled “Why it matters”Library complexity estimation helps answer questions like:
- Is my library saturated? If the complexity curve plateaus, additional sequencing will mostly produce duplicate molecules.
- How many unique molecules can I expect? The extrapolation predicts distinct molecule counts at depths beyond what was actually sequenced.
- Should I sequence more? If the curve is still rising steeply at the current depth, more sequencing will still yield new molecules.
The Good-Toulmin method
Section titled “The Good-Toulmin method”Preseq uses the Good-Toulmin rational function extrapolation to predict library complexity from the observed frequency-of-frequencies histogram (how many fragments were seen exactly 1 time, 2 times, etc.). Bootstrap resampling provides confidence intervals around the extrapolation.
Output files
Section titled “Output files”All Preseq output files use the BAM file stem as a prefix and are written to a
preseq/ subdirectory under the output directory. Use --flat-output to write
all files directly to the output directory instead.
Directorypreseq/
sample.lc_extrap.txtLibrary complexity extrapolation curve
Complexity curve
Section titled “Complexity curve”File: <sample>.lc_extrap.txt
A tab-separated file with one row per extrapolation point. The first data row is always zeros (representing zero sequencing depth). Columns:
| Column | Description |
|---|---|
TOTAL_READS | Sequencing depth (number of fragments) |
EXPECTED_DISTINCT | Predicted number of distinct molecules at this depth |
LOWER_0.95CI | Lower bound of the 95% confidence interval |
UPPER_0.95CI | Upper bound of the 95% confidence interval |
The confidence level (default 95%) is configurable. Values are formatted to 1
decimal place. Confidence interval values may be - when the bootstrap
produces undefined results (typically at very high extrapolation depths).
Example:
TOTAL_READS EXPECTED_DISTINCT LOWER_0.95CI UPPER_0.95CI0.0 0.0 0.0 0.01000000.0 897331.6 895859.5 899559.92000000.0 1704183.8 1701496.5 1708487.03000000.0 2450443.8 2446703.6 2456603.0This file is directly compatible with MultiQC’s Preseq module for visualization in multi-sample QC reports.
Interpreting results
Section titled “Interpreting results”Complexity curve shape
Section titled “Complexity curve shape”- Steep initial rise: most fragments are unique at low depths, indicating good complexity.
- Gradual plateau: library is approaching saturation; additional sequencing yields diminishing returns.
- Sharp early plateau: low complexity library with many duplicates even at modest depths.
- Still rising at current depth: library has remaining complexity to capture with additional sequencing.
Confidence intervals
Section titled “Confidence intervals”Wide confidence intervals at high extrapolation depths are normal. The extrapolation becomes increasingly uncertain further from the observed data. Narrow intervals near the observed depth and widening intervals at high depths indicate a well-behaved estimate.
Benchmarks
Section titled “Benchmarks”This section compares RustQC’s Preseq lc_extrap output against Preseq v3.2.0,
the version used by nf-core/rnaseq. Benchmarks were
run on AWS cloud infrastructure on 2026-03-09.
Performance
Section titled “Performance”Note: RustQC runtime shown is for all tools combined in a single pass. See Benchmark Details for a full breakdown.
The extrapolation computation itself is fast (under 1 second) — it is purely a function of the histogram data.
Small dataset (~52K reads, chr6)
| Tool | Runtime | RSS |
|---|---|---|
| preseq lc_extrap (standalone) | 1.0s | 24.9 MB |
| RustQC (all tools, single pass) | 25.9s | 182.1 MB |
Large dataset (GM12878 REP1, ~186M reads)
| Tool | Runtime | RSS | CPU |
|---|---|---|---|
| preseq lc_extrap (standalone) | 39m 9s | 2.0 GB | 102.2% |
| RustQC (all tools, single pass) | 14m 54s | 11.4 GB | 174.2% |
Output comparison
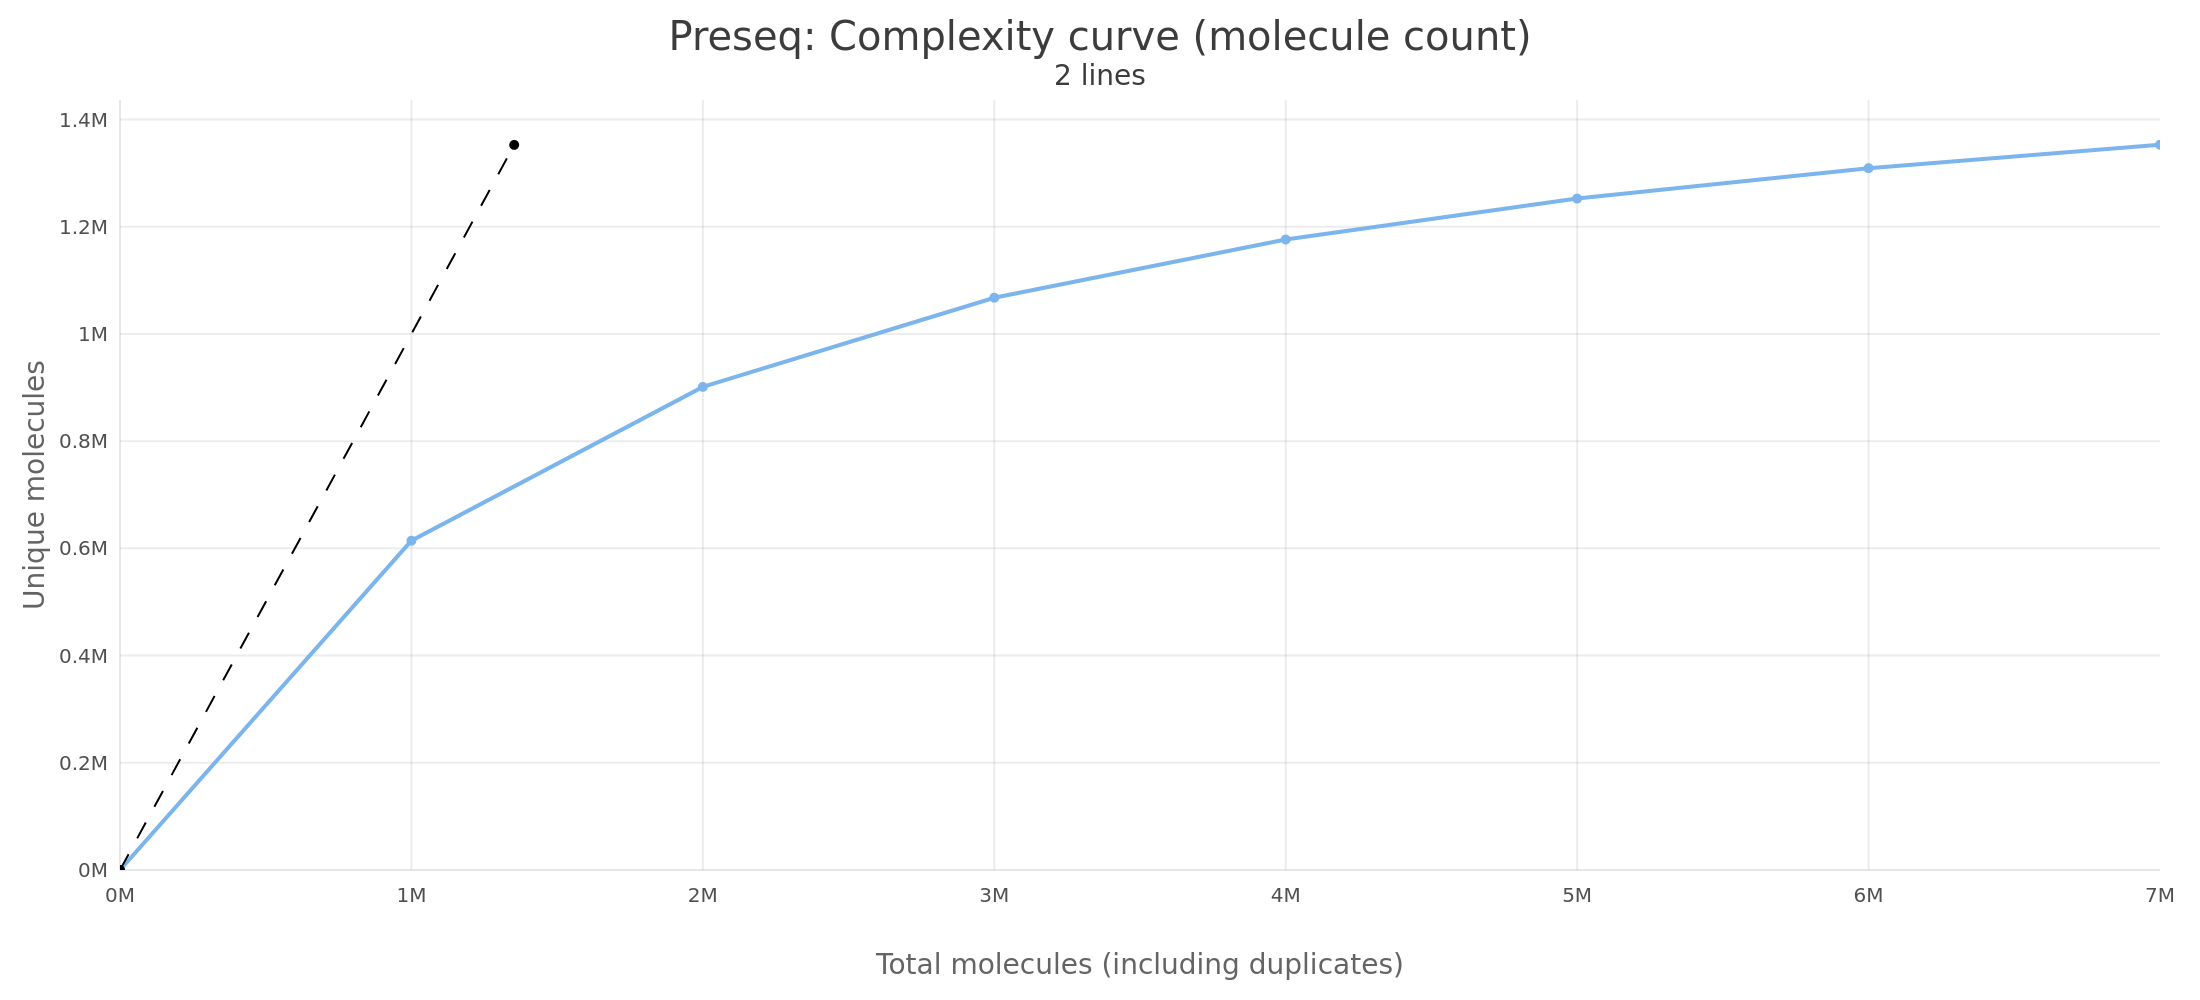
Section titled “Output comparison”Small dataset (test, ~52K reads, chr6)
The small dataset produces byte-identical output between Preseq v3.2.0 and RustQC. All values in all columns match exactly across all sampled read depths.
Sample output (first few rows):
| Total reads | Preseq v3.2.0 | RustQC | Difference |
|---|---|---|---|
| 0 | 0.0 | 0.0 | 0.00% |
| 1,000,000 | 614,257.9 | 614,257.9 | 0.00% |
| 2,000,000 | 901,221.3 | 901,221.3 | 0.00% |
| 3,000,000 | 1,067,567.2 | 1,067,567.2 | 0.00% |
| 4,000,000 | 1,176,137.1 | 1,176,137.1 | 0.00% |
| 5,000,000 | 1,252,577.7 | 1,252,577.7 | 0.00% |
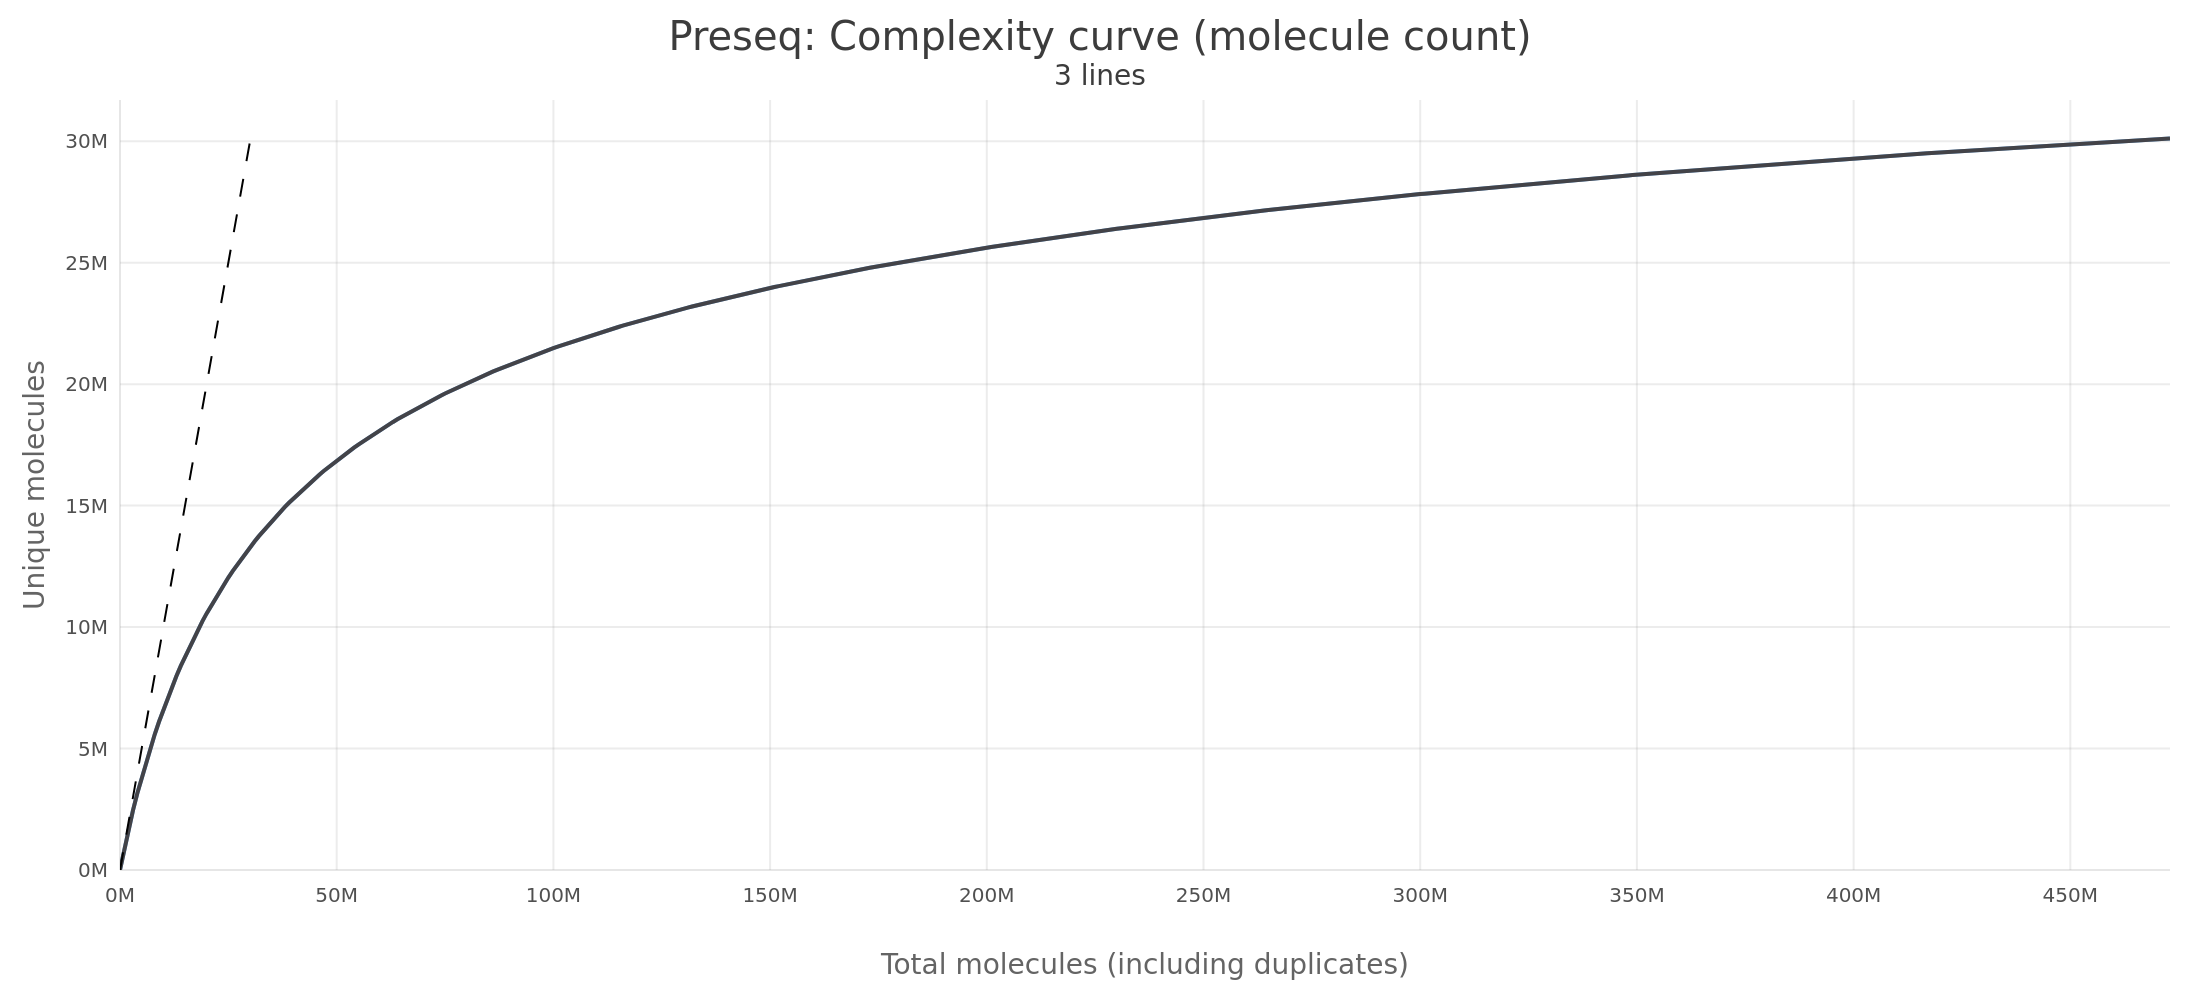
Large dataset (GM12878 REP1, ~186M reads, 10 GB BAM)
On Linux, RustQC produces byte-identical output to Preseq v3.2.0 - every
value in every column matches exactly. This is achieved by using the same C++
standard library’s std::mt19937 and std::binomial_distribution via FFI,
which gives identical random number sequences for the same seed.
Observed differences between the two tools on AWS Linux are at most plus or minus 2 in the floating-point representation (24 of 10,001 rows differ) — sub-ULP rounding noise with no practical significance.
| Total reads | Preseq v3.2.0 | RustQC | Difference |
|---|---|---|---|
| 1,000,000 | 900,745.5 | 900,745.0 | ~0.00% |
| 10,000,000 | 6,604,169.5 | 6,604,169.0 | ~0.00% |
| 50,000,000 | 16,854,150.0 | 16,854,150.0 | 0.00% |
| 100,000,000 | 21,479,538.3 | 21,479,538.3 | 0.00% |
| 500,000,000 | 30,374,922.2 | 30,374,922.2 | 0.00% |
| 1,000,000,000 | 33,285,514.7 | 33,285,514.7 | 0.00% |
Fragment counting
The fragment histogram (frequency-of-frequencies table) is the input to the extrapolation algorithm. RustQC’s parallel hash-based counting matches Preseq’s priority-queue-based mate merging within 0.001% for the singleton count (the most sensitive histogram bin).
| Metric | Preseq v3.2.0 | RustQC |
|---|---|---|
| Total fragments | 93,003,768 | 93,003,768 |
| Distinct fragments | ~52.4M | ~52.4M |
| Singleton count | Matches within 0.001% | Matches within 0.001% |
Confidence intervals
Section titled “Confidence intervals”Bootstrap confidence intervals overlap between Preseq and RustQC at every extrapolation point. Differences in CI bounds are at most plus or minus 2 in the floating-point representation, indistinguishable from rounding noise.
Configuration
Section titled “Configuration”Preseq parameters can be set via CLI flags or the YAML config file. See the CLI reference and Configuration pages for the full list of options.
Compatibility with Preseq
Section titled “Compatibility with Preseq”The output file format is identical to preseq lc_extrap output and is
compatible with downstream tools that parse Preseq output, including
MultiQC.
RustQC’s implementation matches Preseq v3.2.0’s load_counts_BAM_pe behavior:
- PE mate merging: Both mates of a paired-end read are collated by read
name and merged into a single genomic interval
(chrom, min_start, max_end). Merged fragments exceedingmax_segment_lengthare split back into individual reads, matching Preseq’s-seg_lenbehavior. - Fragment counting: Unique fragments are identified by their
(chrom, start, end)tuple. Duplicate fragments (same interval) are counted for the frequency-of-frequencies histogram that drives the extrapolation. - Extrapolation: Good-Toulmin rational function approximation via continued fractions, with degree selection and bootstrap confidence intervals, all matching the Preseq v3.2.0 algorithm.
C++ FFI for exact bootstrap matching
Section titled “C++ FFI for exact bootstrap matching”The bootstrap confidence intervals require drawing random samples from a
binomial distribution seeded by a Mersenne Twister (MT19937) RNG. Preseq uses
C++ std::mt19937 and std::binomial_distribution from the host C++ standard
library, and different implementations use different algorithms:
- libstdc++ (GCC / Linux): Devroye’s 4-region rejection method with a normal distribution proposal and a waiting-time fallback for small parameters.
- libc++ (Clang / macOS): Kemp’s modal method - a single uniform draw followed by a walk outward from the distribution mode.
These algorithms consume different numbers of RNG values per sample, so even with identical seeds and identical MT19937 state, a pure-Rust reimplementation using a different algorithm would produce diverging bootstrap samples.
To solve this, RustQC links directly against the host’s C++ standard library
via a small FFI shim (cpp/rng_shim.cpp) compiled at build time by the
cc crate. This means:
- On Linux (libstdc++), RustQC uses the same Devroye algorithm as a GCC-compiled Preseq binary.
- On macOS (libc++), RustQC uses the same Kemp algorithm as a Clang-compiled Preseq binary.
The result is byte-identical bootstrap output when RustQC and Preseq are compiled with the same C++ standard library and use the same seed.
Platform summary
Section titled “Platform summary”| Platform | Match level | Notes |
|---|---|---|
| Linux (libstdc++) | Byte-identical | Same Devroye algorithm, same glibc math functions |
| macOS (libc++) | Minor differences (~0.02-1.8%) | Kemp algorithm differs; Apple’s exp() may differ from glibc by a few ULPs |
Linux arm64 and x86_64 produce identical results - glibc math functions (exp,
lgamma, etc.) are consistent across architectures.
References
Section titled “References”- Preseq: Daley T, Smith AD. Predicting the molecular complexity of sequencing libraries. Nature Methods. 2013;10(4):325-327. Preseq website