dupRadar
What is dupRadar?
Section titled “What is dupRadar?”In DNA sequencing, PCR duplicates are straightforward to identify and remove: reads with identical alignment coordinates are likely amplification artifacts. In RNA-seq, the situation is more nuanced.
Highly expressed genes produce many RNA fragments. When sequencing depth is sufficient, some of these independent fragments will share the same start and end positions purely by chance. These are natural duplicates — biologically real, not PCR artifacts. Removing them would distort expression estimates.
dupRadar addresses this by analyzing duplication rates in the context of expression level. Rather than applying a blanket duplicate removal, it models the expected relationship between how highly a gene is expressed and what fraction of its reads are marked as duplicates.
At low expression levels, duplicates are almost certainly PCR artifacts. At high expression levels, a baseline level of duplication is expected and biologically meaningful.
Why it matters
Section titled “Why it matters”Duplicate rate analysis helps answer quality questions about an RNA-seq library:
- Was the library over-amplified? If low-expression genes show high duplication rates, too many PCR cycles were used.
- Is the library complex enough? Low-complexity libraries produce high duplication across all expression levels.
- Can I trust the expression estimates? If duplication follows the expected expression-dependent pattern, the data is likely reliable.
This is useful for experiment QC, troubleshooting library preparation, and deciding whether to include a sample in downstream analysis.
The logistic regression model
Section titled “The logistic regression model”dupRadar fits a logistic regression to the relationship between expression level and duplication rate. RustQC implements this same model using iteratively reweighted least squares (IRLS).
The model:
duplication_rate = 1 / (1 + exp(-(intercept + slope * x)))where x is log10(reads per kilobase).
Intercept: Controls the baseline duplication rate at zero expression.
- Values close to 0 (or negative) indicate good library quality — genes with few reads have few duplicates.
- Values above 0.5 indicate significant PCR over-amplification — even lowly expressed genes have high duplication rates.
Slope: Controls how steeply duplication rises with expression.
- Positive values mean duplication increases with expression, which is the expected biological pattern.
- Very high slope values with a low intercept indicate a well-prepared library where duplication is driven by expression level rather than PCR artifacts.
- A low slope combined with a high intercept suggests uniform over-amplification.
| Intercept | Slope | Interpretation |
|---|---|---|
| Low (~0) | Moderate-high | Good library. Duplicates are expression-dependent. |
| High (>0.5) | Low | Over-amplified. Duplicates everywhere. |
| High (>0.5) | High | Over-amplified, but expression signal still visible. |
| Low (~0) | Very low | Good complexity, very little duplication at any level. |
Output files
Section titled “Output files”All dupRadar output files use the BAM file stem as a prefix (e.g., sample.bam produces sample_dupMatrix.txt) and are written to a dupradar/ subdirectory under the output directory. Use --flat-output to write all files directly to the output directory instead. Each output can be individually enabled or disabled via the configuration file.
Directorydupradar/
sample_dupMatrix.txtDuplication matrix (core data table)sample_intercept_slope.txtFitted model intercept and slopesample_duprateExpDens.pngDensity scatter plotsample_duprateExpDens.svgsample_duprateExpBoxplot.pngDuplication rate boxplotsample_duprateExpBoxplot.svgsample_expressionHist.pngExpression histogramsample_expressionHist.svgsample_dup_intercept_mqc.txtMultiQC general statisticssample_duprateExpDensCurve_mqc.txtMultiQC fitted curve data
Duplication matrix
Section titled “Duplication matrix”File: <sample>_dupMatrix.txt
A tab-separated file with one row per gene and 14 columns. This is the core data table from which all other dupRadar outputs are derived.
| Column | Description |
|---|---|
ID | Gene identifier from the GTF |
geneLength | Gene length in base pairs (non-overlapping exon bases) |
allCountsMulti | Total read count including multi-mappers |
filteredCountsMulti | Read count excluding duplicates, including multi-mappers |
dupRateMulti | Duplication rate with multi-mappers: (all - filtered) / all |
dupsPerIdMulti | Number of duplicate reads (multi-mapper inclusive) |
RPKMulti | Reads per kilobase (multi-mapper inclusive) |
RPKMMulti | Reads per kilobase per million mapped reads (multi-mapper inclusive) |
allCounts | Total read count (unique mappers only) |
filteredCounts | Read count excluding duplicates (unique mappers only) |
dupRate | Duplication rate (unique mappers only) |
dupsPerIdUnique | Number of duplicate reads (unique mappers only) |
RPK | Reads per kilobase (unique mappers only) |
RPKM | Reads per kilobase per million mapped reads (unique mappers only) |
Genes with zero reads have a duplication rate of 0 and RPK/RPKM values of 0. The format and values are identical to R dupRadar’s _dupMatrix.txt output.
Intercept and slope
Section titled “Intercept and slope”File: <sample>_intercept_slope.txt
A two-line text file containing the intercept and slope of the fitted logistic regression model:
intercept 0.03312947025247037slope 1.5522385655558626These parameters define the fitted curve: y = 1 / (1 + exp(-(intercept + slope * x))), where x is log10(reads/kbp) and y is the duplication rate.
dupRadar plots
Section titled “dupRadar plots”RustQC generates three diagnostic plots in both PNG and SVG formats. See the Interpreting plots section below for how to read each plot.
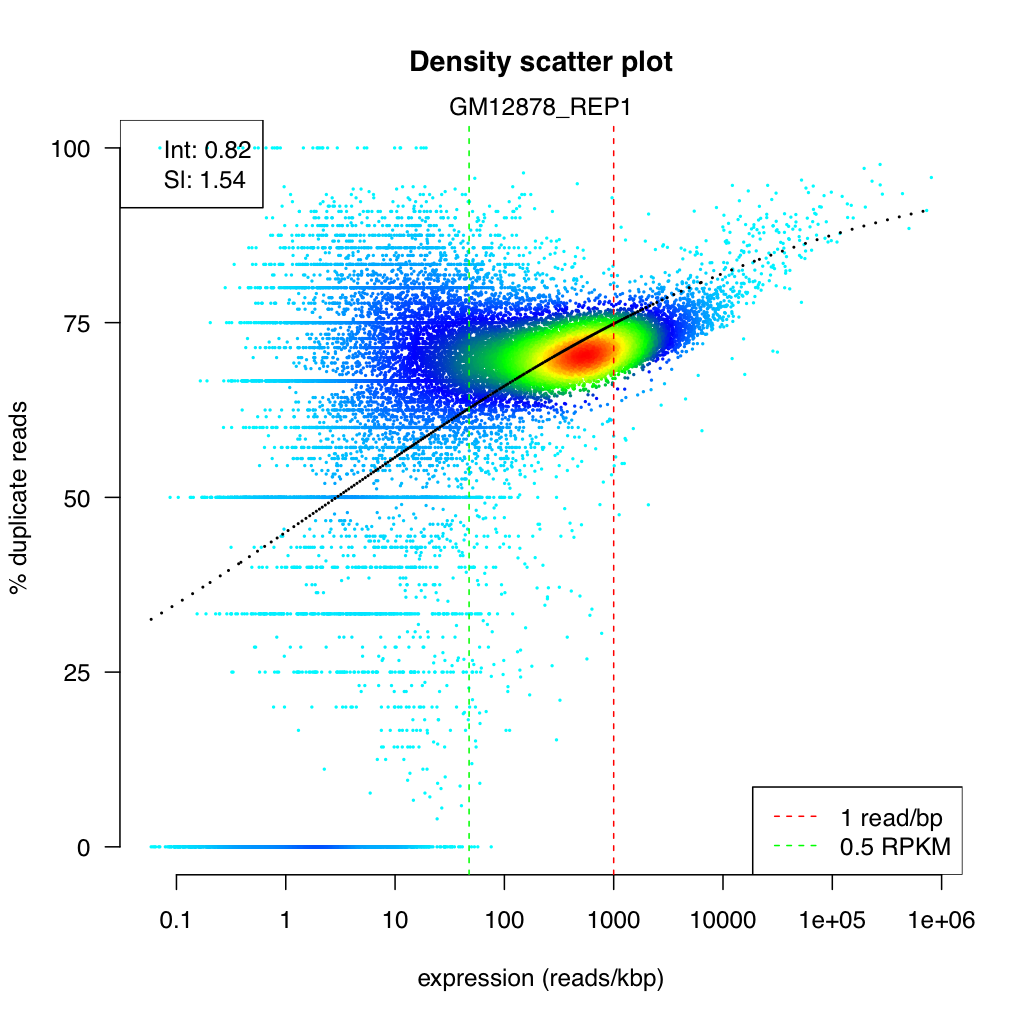
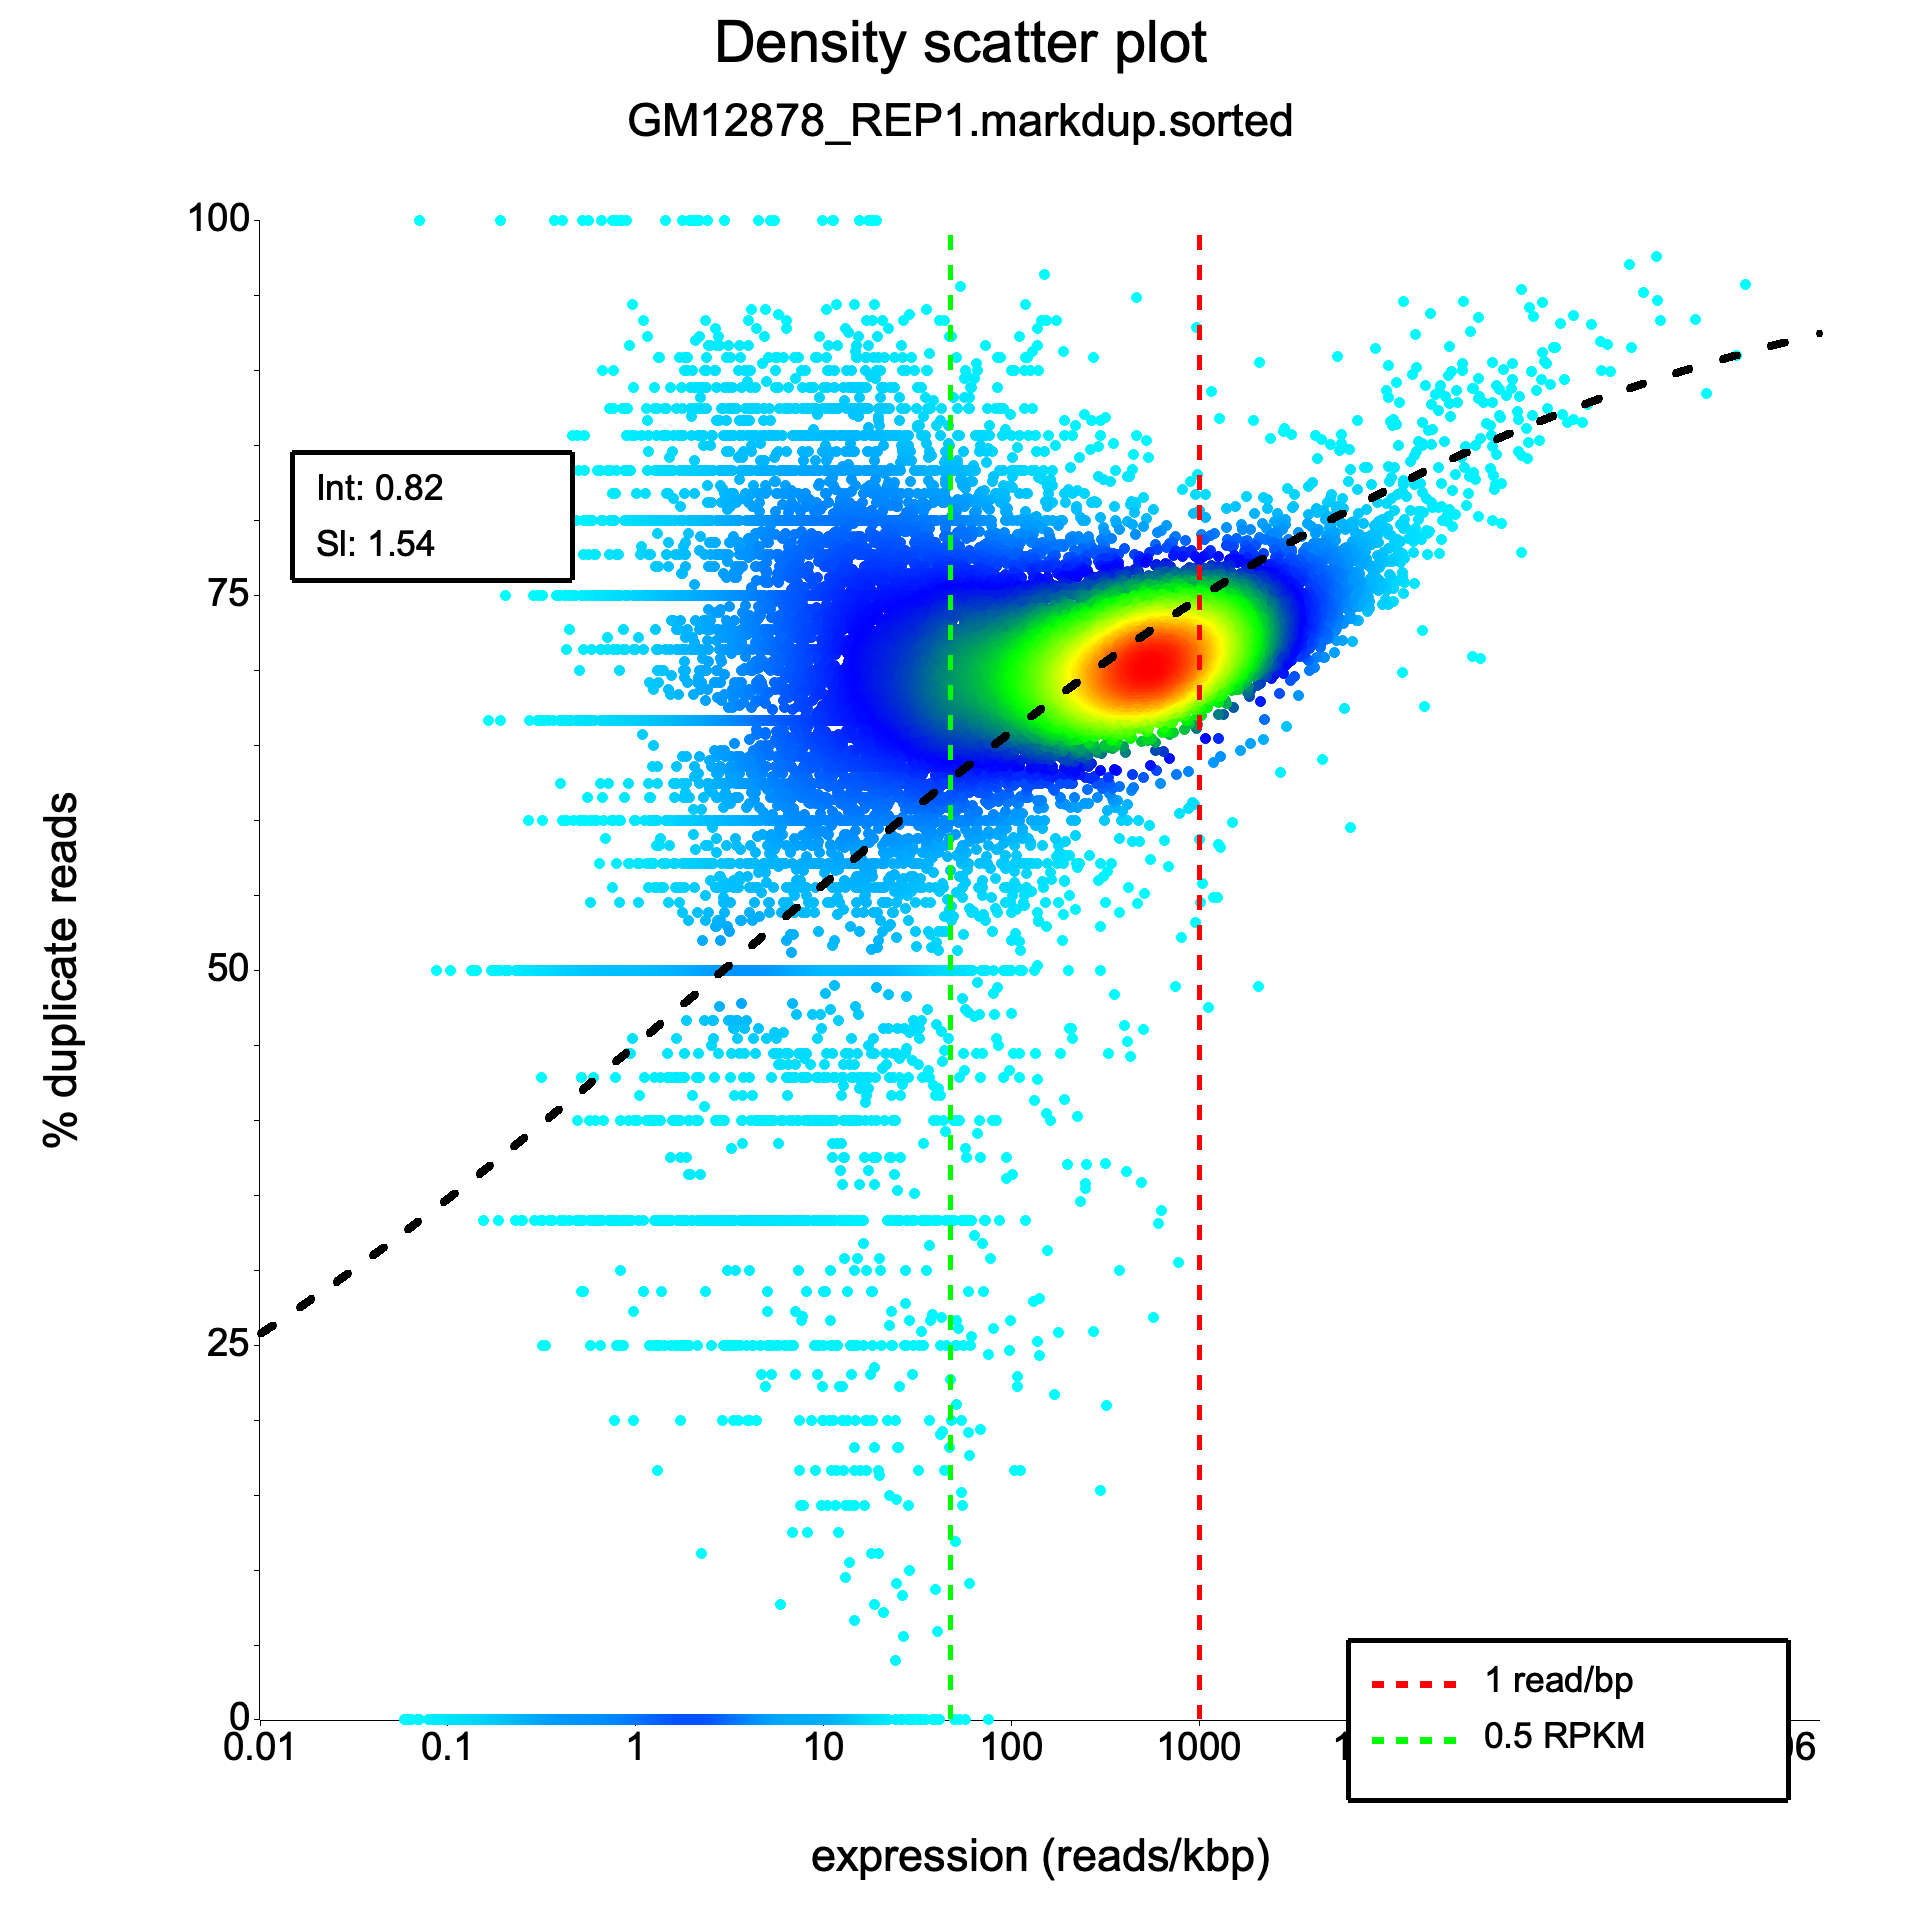
Density scatter plot
Section titled “Density scatter plot”<sample>_duprateExpDens.{png,svg}
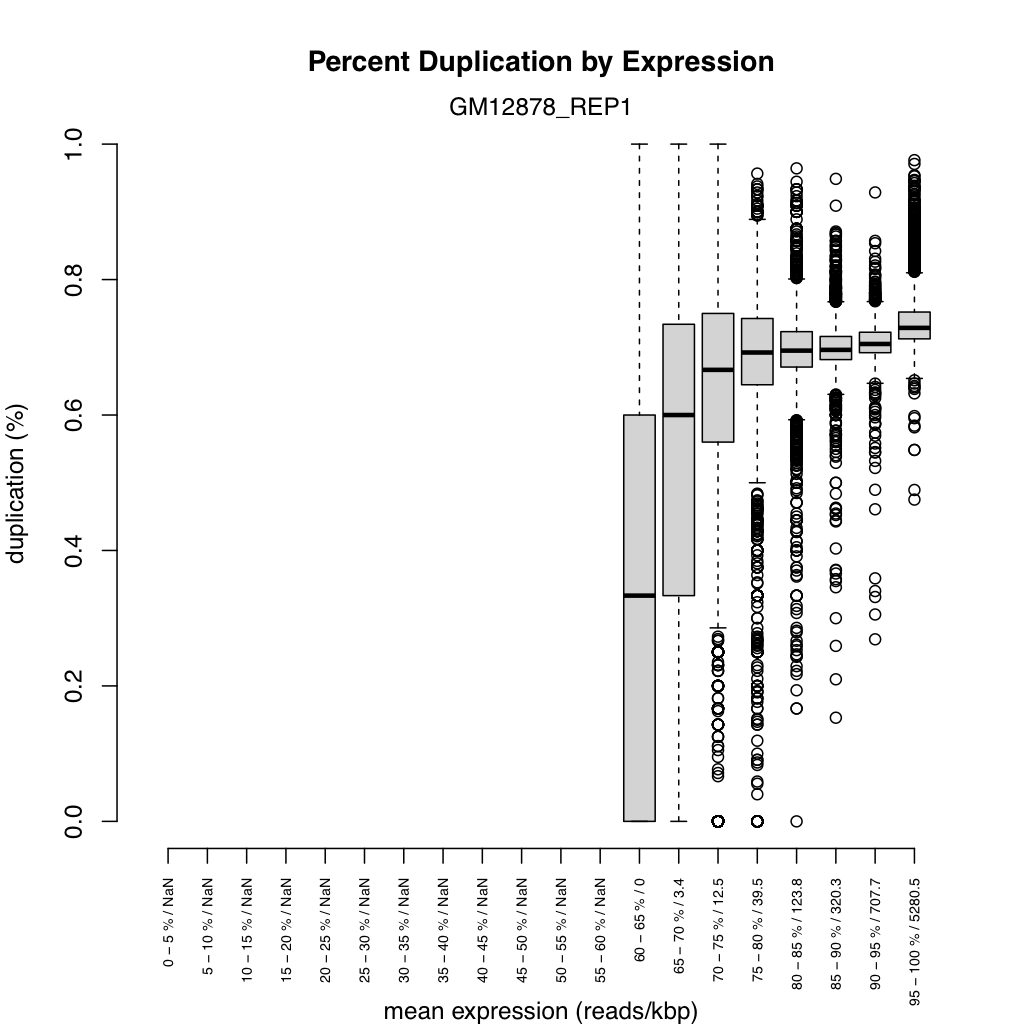
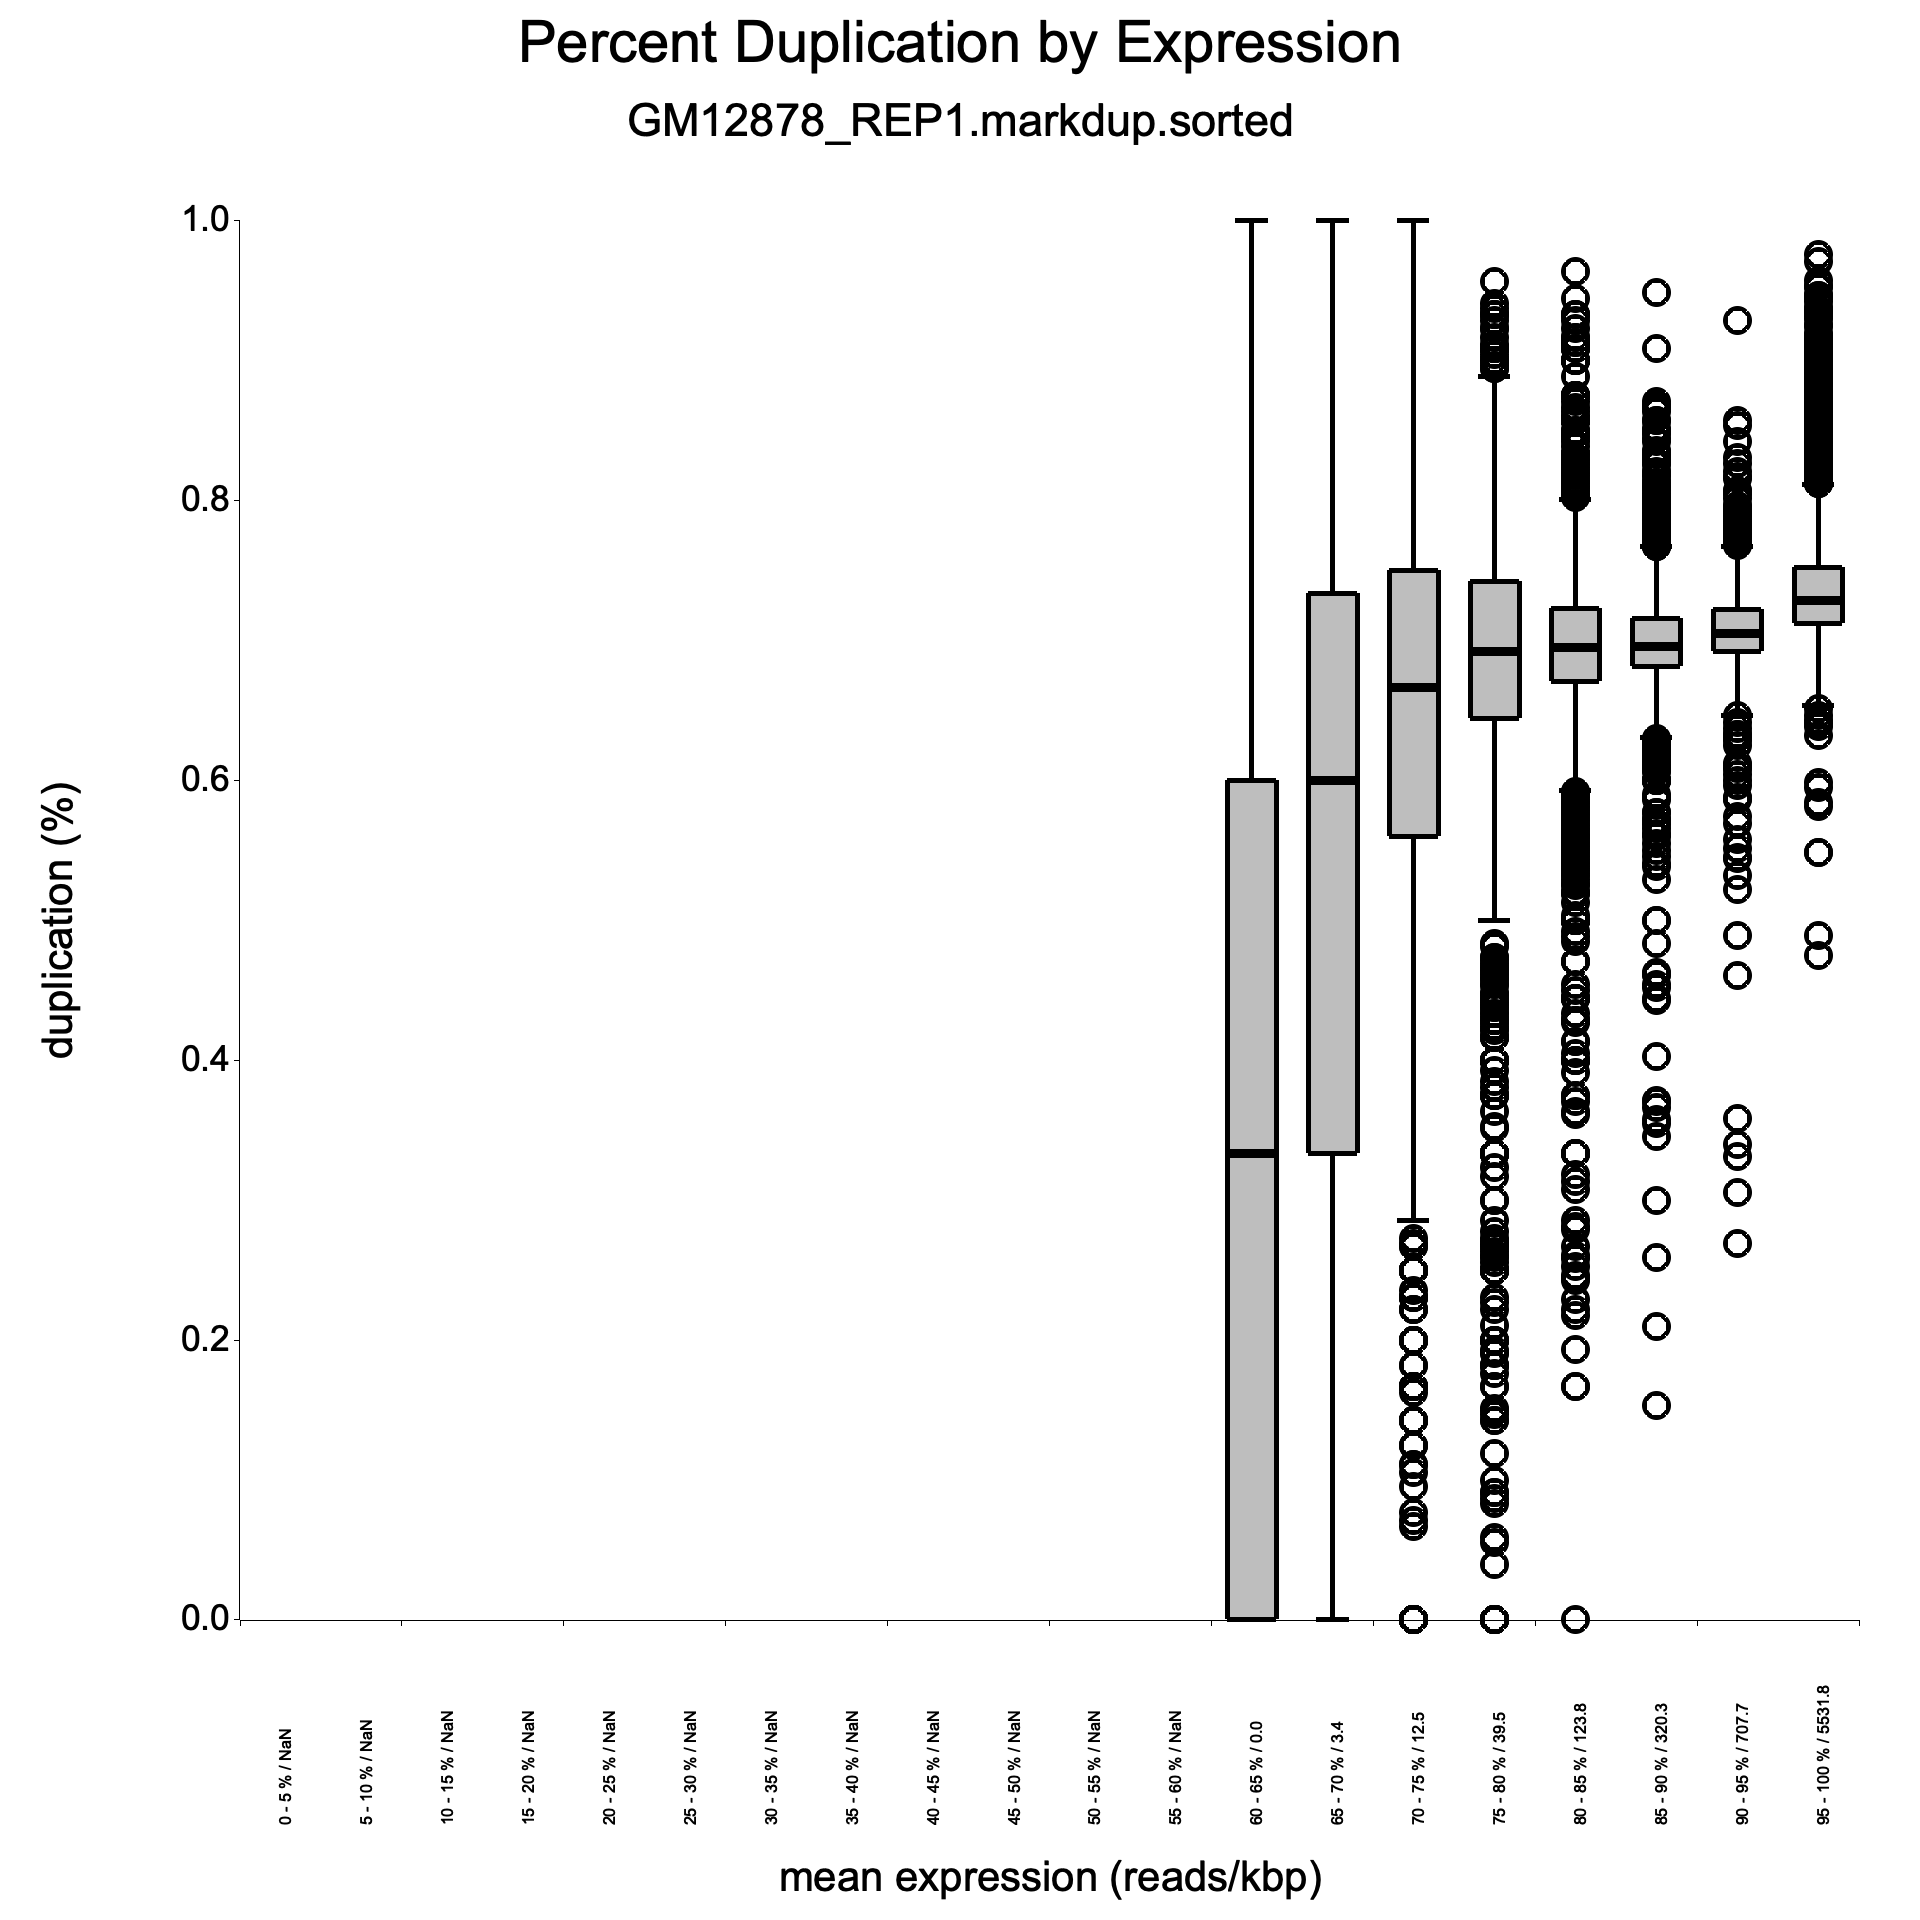
Duplication rate boxplot
Section titled “Duplication rate boxplot”<sample>_duprateExpBoxplot.{png,svg}
Expression histogram
Section titled “Expression histogram”<sample>_expressionHist.{png,svg}
MultiQC files
Section titled “MultiQC files”<sample>_dup_intercept_mqc.txt— Intercept and slope values in MultiQC general statistics format.<sample>_duprateExpDensCurve_mqc.txt— Fitted duplication rate curve data points for MultiQC line plot visualization.
These files integrate with MultiQC for inclusion in multi-sample QC reports.
Interpreting plots
Section titled “Interpreting plots”RustQC generates the same three visualizations as the original dupRadar R package and follows the same conventions.
Density scatter plot
Section titled “Density scatter plot”File: <sample>_duprateExpDens.png / .svg
This is the primary diagnostic plot, showing the relationship between gene expression level and duplication rate.
- X-axis: Expression level as log10(reads per kilobase). Each point is one gene.
- Y-axis: Duplication rate, ranging from 0 (no duplicates) to 1 (all reads are duplicates).
- Color: Point density — brighter colors indicate more genes at that position. This helps reveal where the majority of genes fall, even when thousands of points overlap.
- Red curve: The fitted logistic regression model.
Expected patterns in a well-prepared library:
- Genes with low expression cluster at the bottom-left with duplication rates near zero. At low sequencing depth, it is unlikely for independent fragments to share identical start/end positions.
- Genes with high expression have moderately higher duplication rates. This is expected — highly expressed genes produce many fragments, and some will share positions by chance alone.
- The fitted curve rises gradually from left to right, staying below 0.5 for most of the expression range.
Duplication rate boxplot
Section titled “Duplication rate boxplot”File: <sample>_duprateExpBoxplot.png / .svg
Shows the distribution of duplication rates across expression-level bins, providing a complementary view to the density scatter plot.
- X-axis: Expression bins (log10 reads per kilobase).
- Y-axis: Duplication rate.
- Boxes: The interquartile range (25th to 75th percentile) of duplication rates for genes within each bin.
- Horizontal line in each box: Median duplication rate for that bin.
- Whiskers: Extend to the most extreme points within 1.5 times the IQR.
Boxes should be near zero at low expression and gradually rise at higher expression levels. Very wide boxes at low expression suggest inconsistent library preparation. The median line within each box should track the general trend seen in the density scatter plot. This plot helps determine whether high duplication rates are expression-dependent (expected) or uniform across all expression levels (problematic).
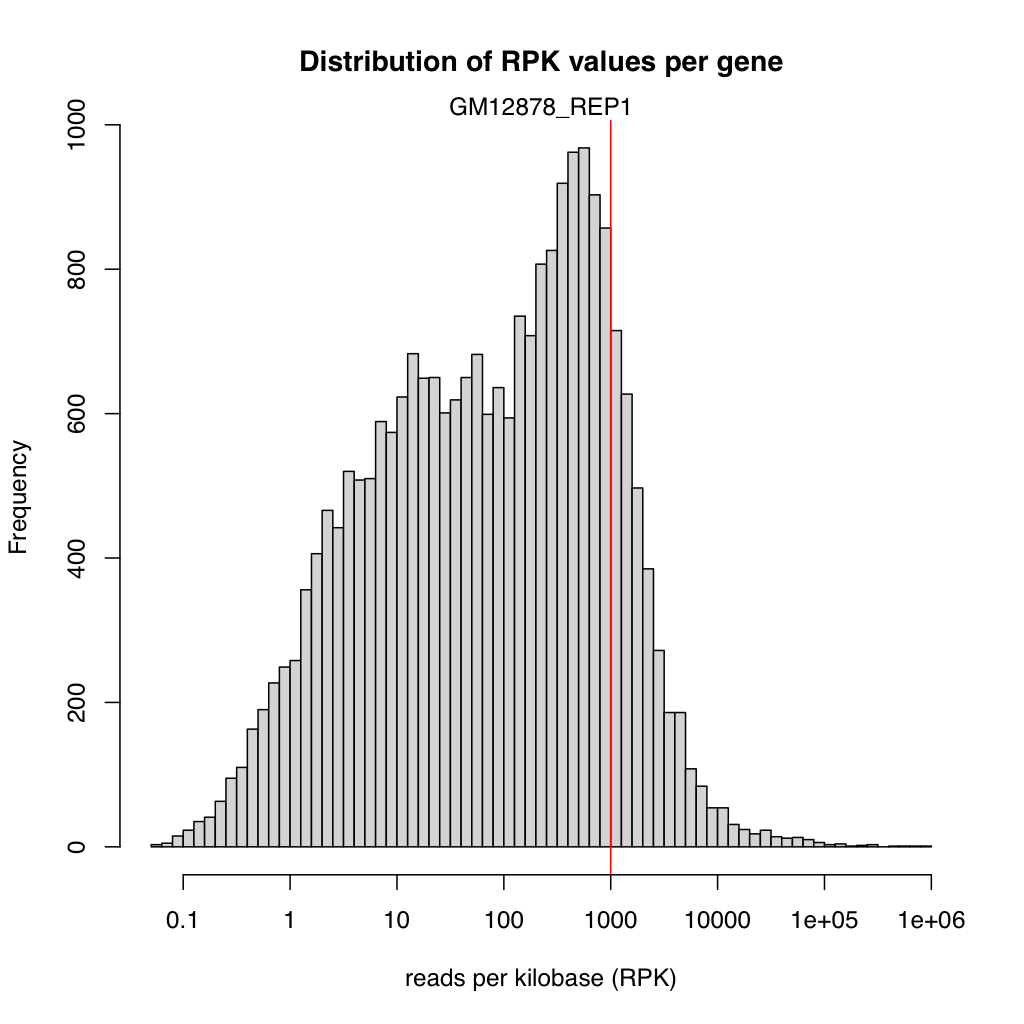
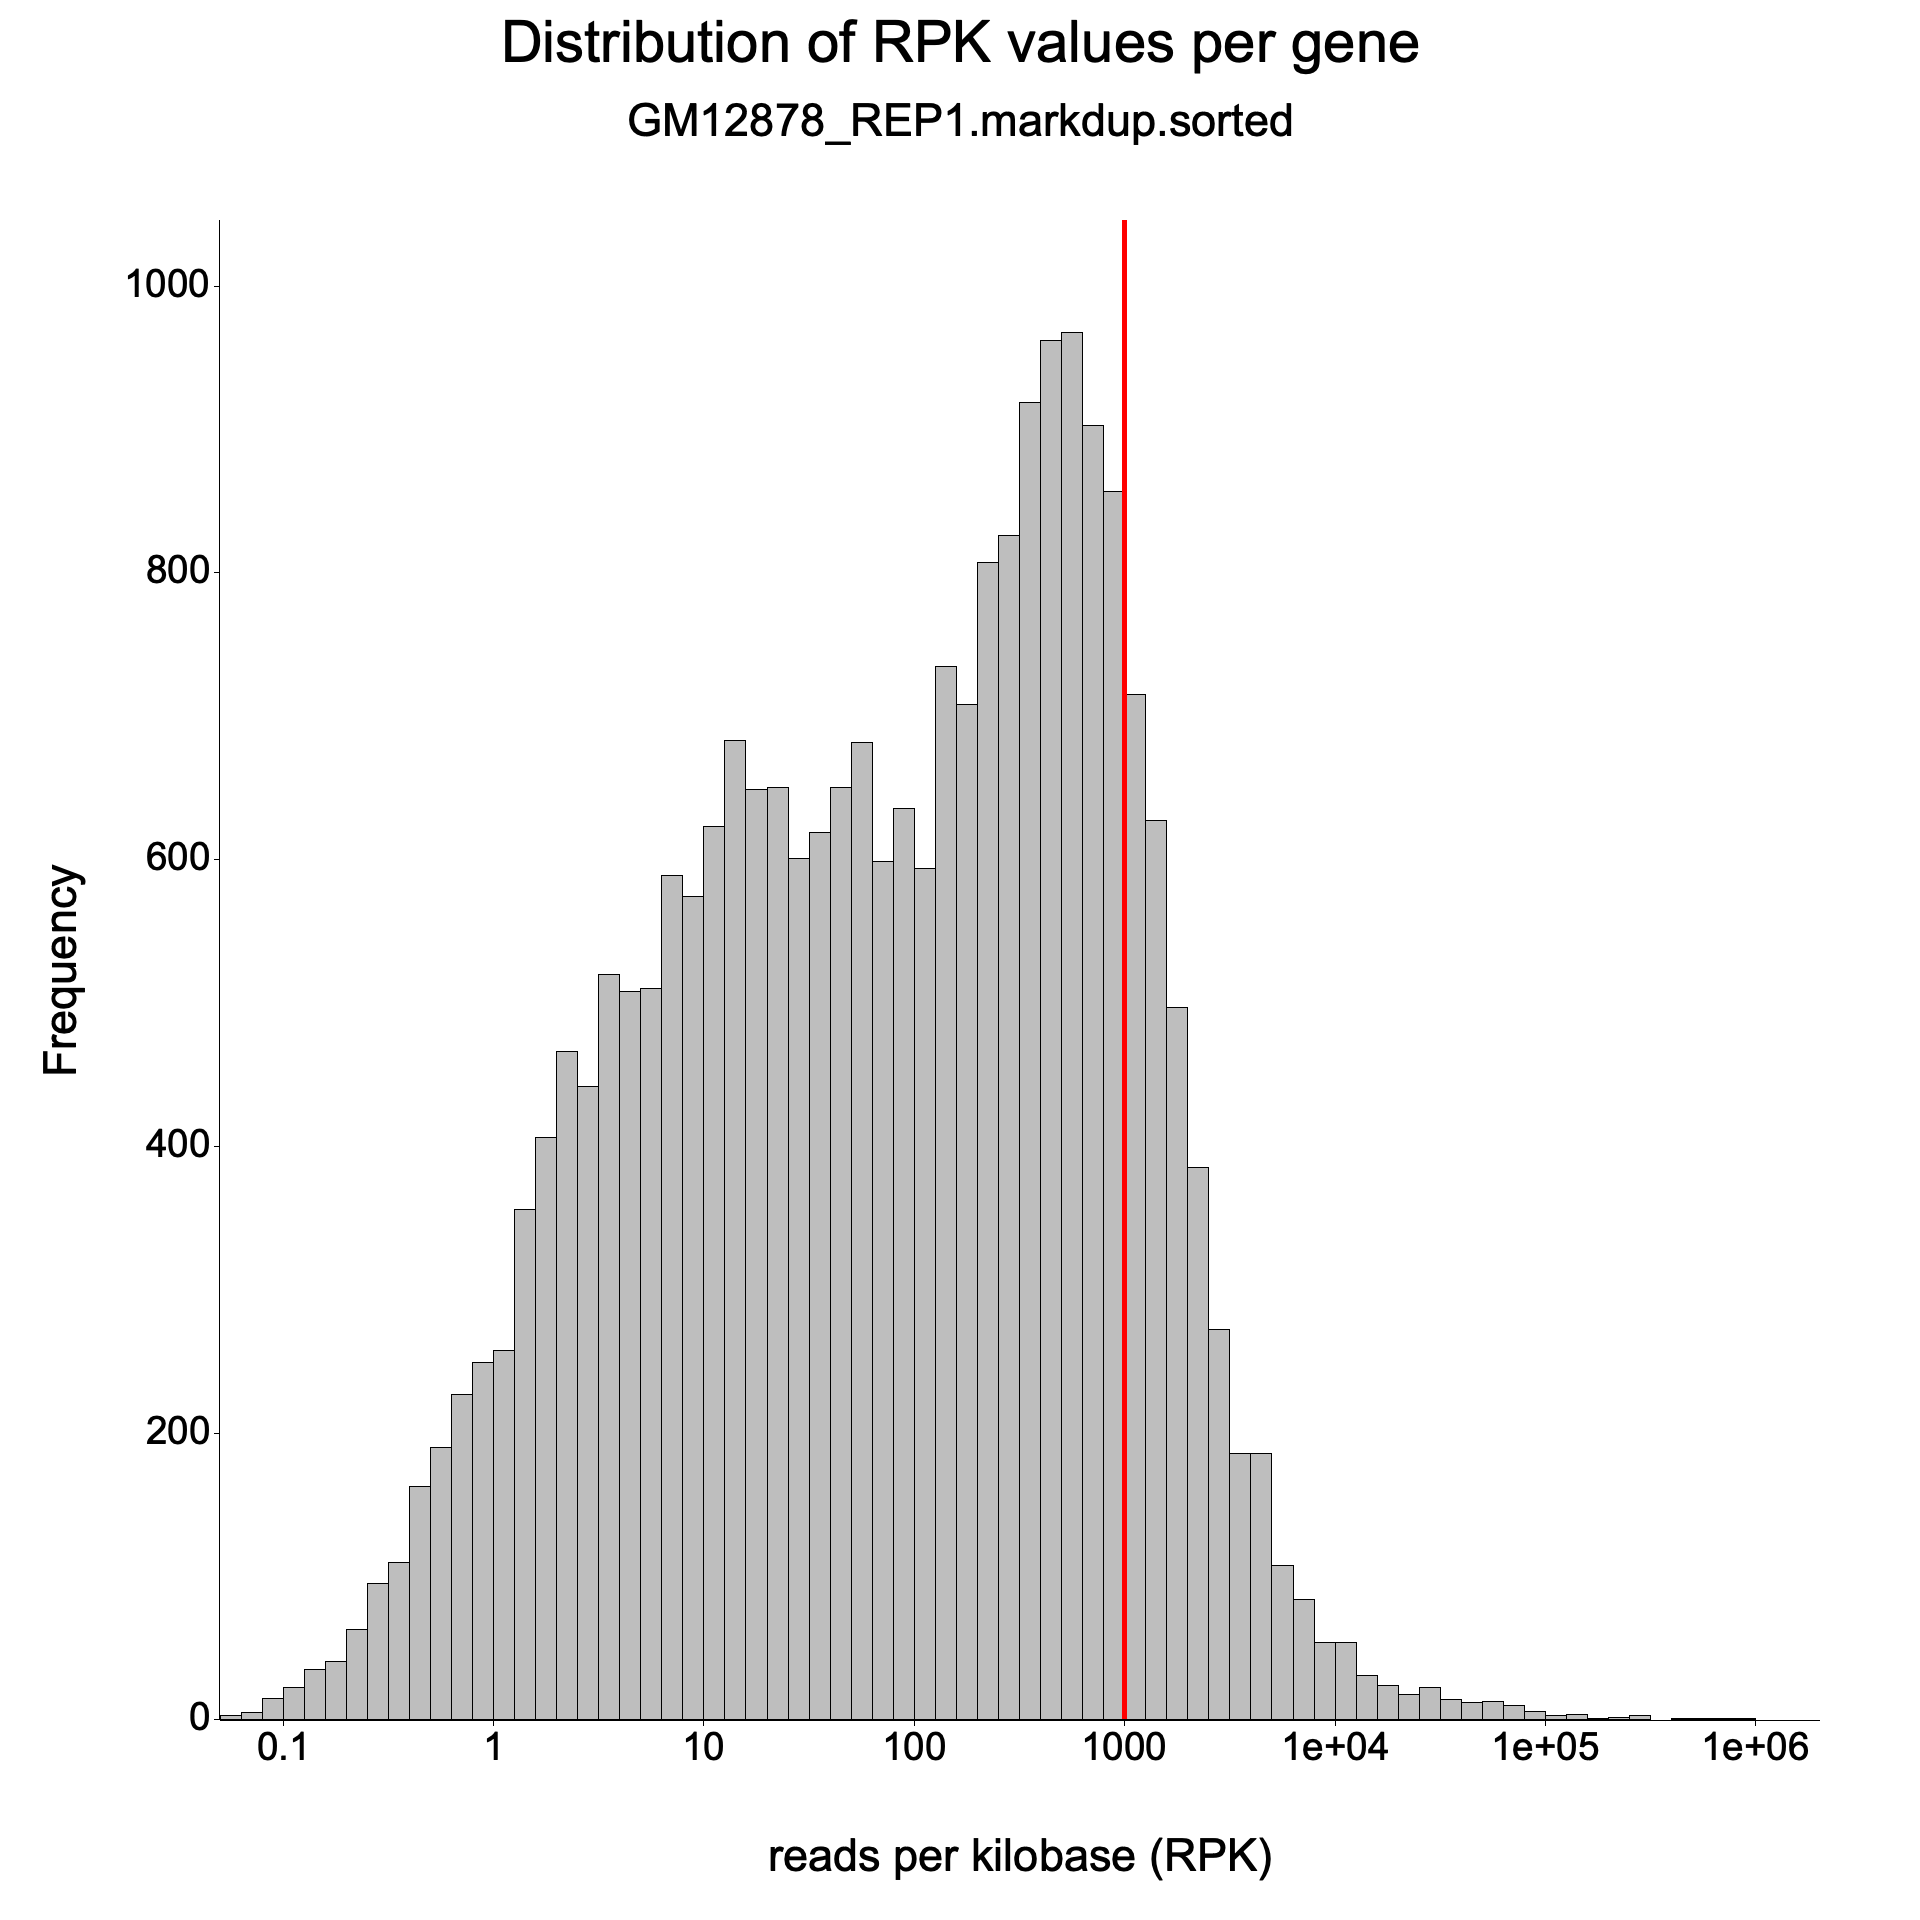
Expression histogram
Section titled “Expression histogram”File: <sample>_expressionHist.png / .svg
A histogram of gene expression levels across all genes in the annotation.
- X-axis: Expression level as log10(reads per kilobase).
- Y-axis: Number of genes.
A bimodal distribution is common: one peak near zero (unexpressed or very lowly expressed genes) and another peak at moderate expression levels. The position and height of the peaks indicate the dynamic range of the experiment. A narrow distribution shifted to the left suggests low overall sequencing depth or poor library complexity.
How to spot problems
Section titled “How to spot problems”Very high duplication at low expression
Section titled “Very high duplication at low expression”If genes with few reads already show high duplication rates, this indicates technical PCR duplication rather than biological signal. The density scatter plot will show points clustered in the upper-left region, and the fitted curve will have a high intercept.
Flat duplication curve
Section titled “Flat duplication curve”If the duplication rate is uniformly high across all expression levels (a flat, high curve), this suggests a severe PCR amplification issue — the library has very low complexity and most reads are duplicates regardless of gene expression.
Very low duplication everywhere
Section titled “Very low duplication everywhere”Duplication rates near zero across all expression levels, including highly expressed genes, may indicate that duplicates were not properly marked in the BAM file. Verify that a duplicate-marking tool was run before RustQC.
Normal vs. problematic libraries
Section titled “Normal vs. problematic libraries”| Indicator | Good library | Problematic library |
|---|---|---|
| Intercept | Close to 0 | Above 0.5 |
| Low-expression genes | Near-zero dup rate | Elevated dup rate |
| Curve shape | Gradual rise | Flat and high, or steep early rise |
| Boxplot spread | Tight boxes at low expression | Wide boxes everywhere |
Benchmarks
Section titled “Benchmarks”RustQC produces output matching R dupRadar to floating-point precision. All 14 output columns are identical, and the fitted model parameters agree to 9-10 significant figures. The benchmarks below quantify the performance difference on real RNA-seq data, measured on AWS (2026-03-09).
Performance
Section titled “Performance”Small dataset (~52K reads, chr6)
| Tool | Runtime | Max RSS |
|---|---|---|
| R dupRadar | 7.2s | 219.1 MB |
| RustQC (all tools) | 25.9s | 182.1 MB |
Large dataset (GM12878 REP1, ~186M reads)
| Tool | Runtime | Max RSS |
|---|---|---|
| R dupRadar | 2h 14m 24s | 491 MB |
| RustQC (all tools) | 14m 54s | 11.4 GB |
Note: RustQC runtime shown is for all tools combined in a single pass. See Benchmark Details for a full breakdown.
Results comparison
Section titled “Results comparison”Small dataset
| Metric | dupRadar (R) | RustQC | Match |
|---|---|---|---|
| Intercept | 0.033129470167 | 0.033129470252 | ~9e-11 diff |
| Slope | 1.552238567839 | 1.552238565556 | ~2e-9 diff |
| Genes total | 2,905 | 2,905 | Exact |
| Genes with reads (unique) | 620 | 620 | Exact |
| Genes with reads (multi) | 640 | 640 | Exact |
| Genes with duplicates | 203 | 203 | Exact |
| allCounts (sum) | 21,262 | 21,262 | Exact |
| filteredCounts (sum) | 18,609 | 18,609 | Exact |
| allCountsMulti (sum) | 23,685 | 23,685 | Exact |
| filteredCountsMulti (sum) | 20,820 | 20,820 | Exact |
| Total values compared | 37,765 | 37,765 | — |
| Value mismatches | — | 0 | — |
Large dataset
| Metric | dupRadar (R) | RustQC | Match |
|---|---|---|---|
| Intercept | 0.819159852242 | 0.819159852329 | ~9e-11 diff |
| Slope | 1.536856867902 | 1.536856867835 | ~7e-11 diff |
| Genes total | 63,677 | 63,677 | Exact |
| Genes with reads (unique) | 23,855 | 23,855 | Exact |
| Genes with reads (multi) | 24,952 | 24,952 | Exact |
| allCounts (sum) | 65,153,067 | 65,153,067 | Exact |
| filteredCounts (sum) | 15,207,231 | 15,207,231 | Exact |
| allCountsMulti (sum) | 75,766,529 | 75,766,529 | Exact |
| filteredCountsMulti (sum) | 21,986,612 | 21,986,612 | Exact |
| Total values compared | 827,801 | 827,801 | — |
| Value mismatches | — | 0 | — |
The intercept and slope differences are at the 9th-10th significant figure, arising purely from floating-point arithmetic order-of-operations variance. All count columns are integer-identical. Model fit parameters match to 9-10 significant figures across all 63,677 genes, including integer count columns, duplication rates, and RPKM-normalised values.
Configuring outputs
Section titled “Configuring outputs”Each output file can be individually enabled or disabled. See the Configuration page for details.
References
Section titled “References”- dupRadar: Sayols S, Scherzinger D, Klein H. dupRadar: a Bioconductor package for the assessment of PCR artifacts in RNA-Seq data. BMC Bioinformatics. 2016;17(1):428. Bioconductor page
- featureCounts: Liao Y, Smyth GK, Shi W. featureCounts: an efficient general purpose program for assigning sequence reads to genomic features. Bioinformatics. 2014;30(7):923-930. Subread/featureCounts